Discover the Super Trend Fisher Indicator: Analysis and Applications in ProRealTime
Introduction
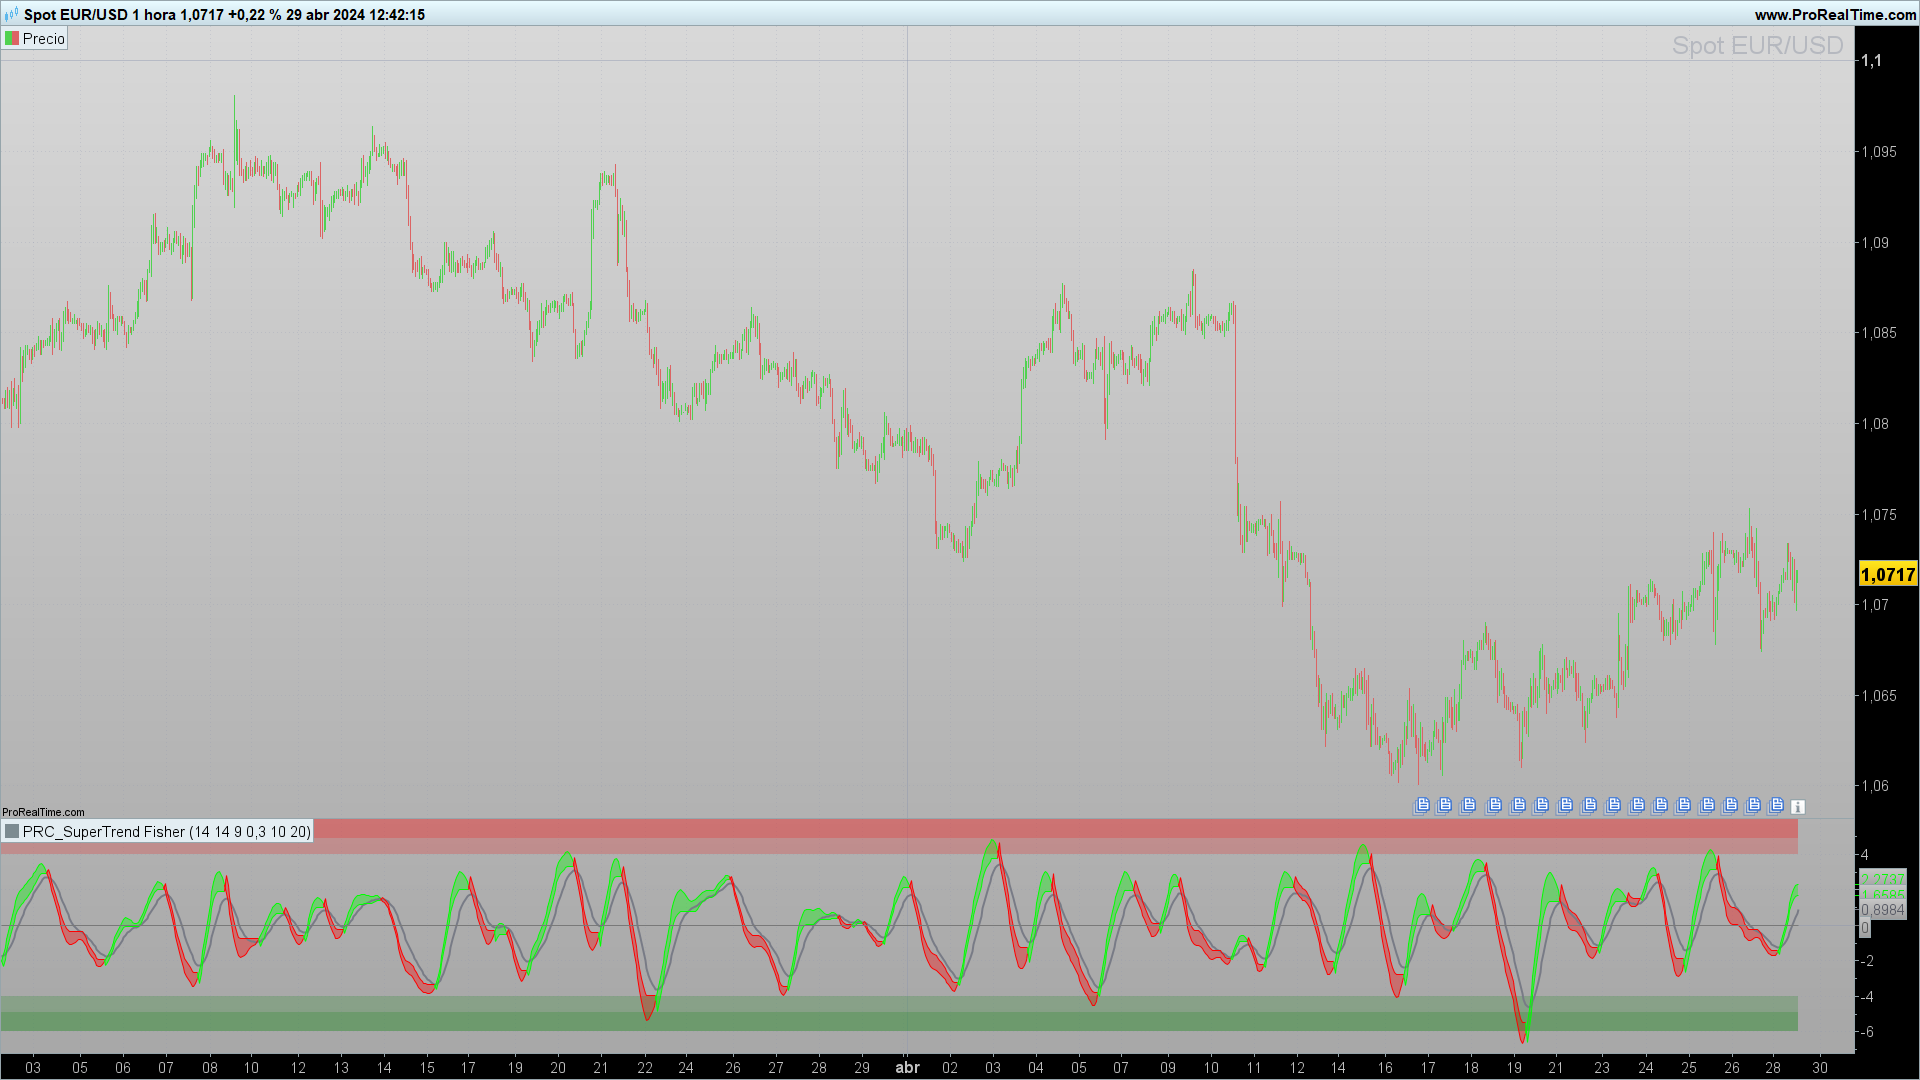
The Super Trend Fisher indicator stands out as an advanced tool that combines several analytical methods to deliver clear and timely signals. This indicator is especially valued for its ability to adapt to different market conditions and its ease of integration into various trading strategies.
Description of the Super Trend Fisher Indicator
The Super Trend Fisher is a complex technical indicator that incorporates elements of the Detrended Price Oscillator, Fisher Transform, and the calculation of the Average True Range (ATR) to dynamically adjust trend levels. Its main goal is to identify the direction of the trend and signal possible reversals, using a methodology that adjusts its parameters in real-time to capture market volatility.
- Detrended Price Oscillator (DPO): Measures the deviation of the price from its moving average, helping to identify short-term price cycles stripped of long-term trends.
- Fisher Transform: Converts prices into a Gaussian distribution to produce clearer and timelier signals.
- Average True Range (ATR): Used to calculate market volatility, the ATR helps adjust the SuperTrend thresholds to be more responsive during volatile market conditions.
- SuperTrend: Combines direction of the trend and volatility, offering a clear visual summary of the current market situation.
Functioning of the Indicator
The Super Trend Fisher uses a combination of analytical techniques to provide an integrated and deeply contextual view of market behavior. Below is an explanation of how each component of the indicator is calculated:
- Calculation of the Detrended Price Oscillator: The moving average is subtracted from the closing price, which helps eliminate long-term price variations and focus on short-term fluctuations.
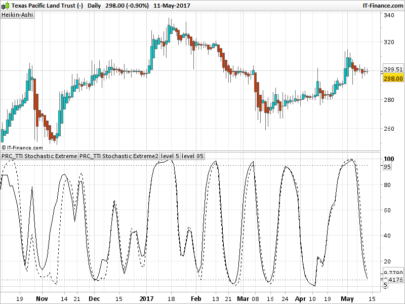
- Application of the Fisher Transform: This transform alters the distribution of price data to make overbought and oversold areas more identifiable and accessible for technical analysis.
- Integration of the ATR: The ATR adjusts the limits of the SuperTrend according to market volatility, allowing the indicator to be effective under different market conditions.
Practical Applications
The Super Trend Fisher indicator is exceptionally useful for traders looking to quickly identify market trends and reversal points. Here are some ways to interpret the signals provided by this indicator:
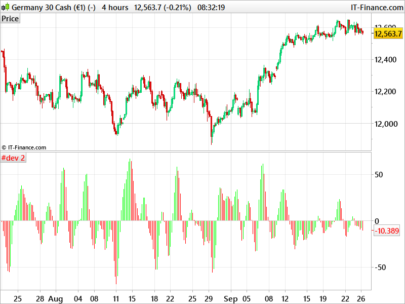
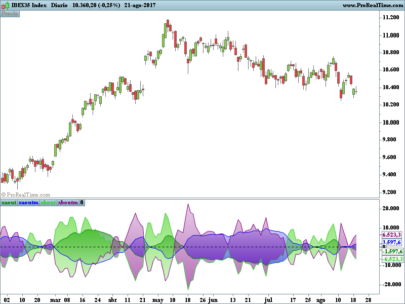
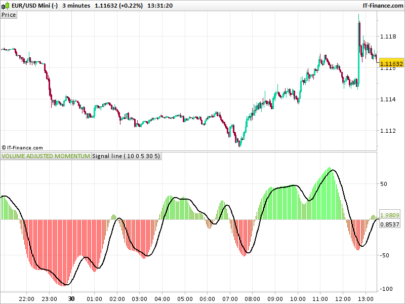
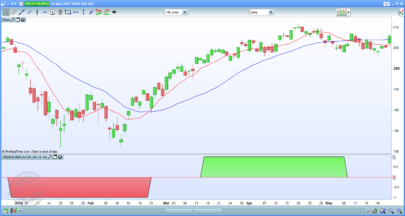
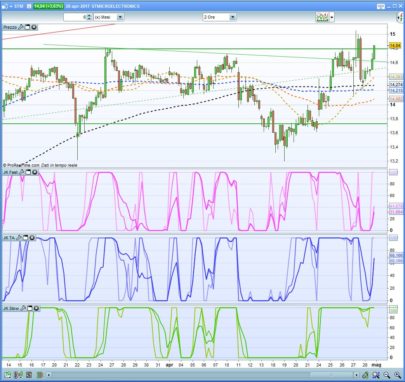
- Trend Identification: When the indicator moves above the zero level and changes color, it indicates a possible entry into an uptrend. Conversely, a movement below the zero level with a color change suggests a downtrend.
- Buy and Sell Signals: A buy signal may be considered when the Super Trend Fisher changes from red to green and is above the zero line. Conversely, a sell signal is suggested when it changes from green to red and is located below the zero line.
- Optimization of Entries and Exits: Combining the Super Trend Fisher with other momentum or volume indicators can help refine entries and exits, thereby improving risk management and the effectiveness of trading strategies.
Setup and Customization
Copy and paste the code provided in the programming section of the editor. Adjust the parameters period, length, len, stFactor, and stPeriod according to your specific needs to tailor the sensitivity and reactivity of the indicator.
|
1 2 3 4 5 6 7 8 9 10 11 12 13 14 15 16 17 18 19 20 21 22 23 24 25 26 27 28 29 30 31 32 33 34 35 36 37 38 39 40 41 42 43 44 45 46 47 48 49 50 51 52 53 54 55 56 57 58 59 60 61 62 63 64 65 66 67 68 69 70 71 72 73 74 75 76 77 78 79 80 81 82 83 84 85 86 87 88 89 90 91 92 93 94 95 96 97 98 99 100 101 102 103 104 105 106 107 108 109 110 111 112 113 114 115 116 117 118 119 120 121 122 123 124 125 126 127 128 129 130 131 132 133 134 135 136 |
//-------------------------------------------------------------------------// //PRC_SuperTrend Fisher //version = 0 //16.04.24 //Iván González @ www.prorealcode.com //Sharing ProRealTime knowledge //-------------------------------------------------------------------------// //-----Inputs--------------------------------------------------------------// period=14//Fair-value Period length=14//EMA length len=9//Fisher Period stFactor=0.3//SuperTrend Factor stPeriod=10//SuperTrend Period l=20//Hma period //-------------------------------------------------------------------------// n=max(period,max(l,length))*3 //-----Detrended Price Oscillator + Standard deviation---------------------// barsback=round(period/2)+1 ma=average[period](close) dpo1=close-ma[barsback] sd = dpo1/(average[period,1](high-low))*100 //-------------------------------------------------------------------------// //-----Fisher Transform Formula + Smoothing--------------------------------// src=sd high1=highest[len](src) low1=lowest[len](src) if barindex <= n then myvalue=src fish1=src MAfish=src else val=0.66*((src-low1)/(high1-low1)-0.5)+0.67*myvalue[1] if val > 0.99 then myvalue=0.999 elsif val < -0.99 then myvalue=-0.999 else myvalue=val endif fish1= 0.5*log((1+myvalue)/(1-myvalue))+0.5*mafish1[1] mafish1=hullaverage[l](fish1) endif //-------------------------------------------------------------------------// source=mafish1 //-------------------------------------------------------------------------// //-----ATR from Fisher transformation--------------------------------------// hh=highest[stPeriod](source) ll=lowest[stPeriod](source) if barindex<=stPeriod then trueRange=hh-ll else trueRange=max(max(hh-ll,abs(hh-source[1])),abs(ll-source[1])) endif alpha = 1/stPeriod if barindex <= n then atr = average[stPeriod](trueRange) else atr = alpha*trueRange + (1-alpha)*atr[1] endif //-------------------------------------------------------------------------// //-----Supertrend Integration----------------------------------------------// upperband=source+stFactor*atr lowerband=source-stFactor*atr if barindex <= n then prevLowerband=source prevUpperband=source else prevLowerband=lowerband[1] prevUpperband=upperband[1] if lowerband>prevlowerband or source[1]<prevlowerband then lowerband=lowerband else lowerband=prevlowerband endif if upperband < prevupperband or source[1]>prevupperband then upperband=upperband else upperband=prevupperband endif endif prevStvalue=stvalue[1] if prevStValue = prevupperband then if source > upperband then stdirection = -1 else stdirection = 1 endif else if source < lowerband then stdirection = 1 else stdirection = -1 endif endif if stdirection = -1 then stvalue=lowerband else stvalue=upperband endif q2= average[length,1](source) //-------------------------------------------------------------------------// //-----Overbought and Oversold Bands---------------------------------------// obLevel = 4.0 osLevel = -4.0 obupper = obLevel obmid = obLevel+0.9 oblower = obLevel + 2 osupper = osLevel osmid = osLevel - 0.9 oslower = osLevel - 2 //-------------------------------------------------------------------------// //-----Color definition----------------------------------------------------// if source > stValue then r =0 g=255 else r=255 g=0 endif if barindex > n then colorbetween(source,stvalue,r,g,0,90) colorbetween(obupper, oblower,"red",50) colorbetween(osupper, oslower,"green",50) colorbetween(obmid, oblower,"red",50) colorbetween(osmid, oslower,"green",50) endif //-------------------------------------------------------------------------// return q2 as "ema fish"coloured(120,123,134)style(line,2),source as "Fish"coloured(r,g,0),stValue as "StValue"coloured(r,g,0),0 as "0" coloured(121,121,121) |
- Application and Analysis: Once the code is adjusted, apply the indicator to the chart. Observe how the indicator interacts with price movements and adjust settings if necessary to optimize signals.
Conclusions
The Super Trend Fisher indicator offers a robust combination of technical analysis and adaptability, making it a valuable tool for any trader. Its ability to integrate multiple analytical techniques into a single indicator allows for a richer and more nuanced interpretation of the markets. As with any trading tool, it is recommended to combine the Super Trend Fisher with proper risk management and a coherent trading strategy.
Share this
No information on this site is investment advice or a solicitation to buy or sell any financial instrument. Past performance is not indicative of future results. Trading may expose you to risk of loss greater than your deposits and is only suitable for experienced investors who have sufficient financial means to bear such risk.
ProRealTime ITF files and other attachments :
Find other exclusive trading pro-tools on ![]()
PRC is also on YouTube, subscribe to our channel for exclusive content and tutorials


Scusa Ivan, ho trovato un’altra versione di supertrend, Kalmana Hull Supertrand, che mi pare interessante ma non mi fa creare un nuovo topic, non so per quale motivo. Provo a incollare il codice qui, se tu potessi tradurlo. Grazie
/////////////////////////////////////////////////////////////// © BackQuant ///////////////////////////////////////////////////////////////
// This Pine Script™ code is subject to the terms of the Mozilla Public License 2.0 at https://mozilla.org/MPL/2.0/
// © BackQuant
//@version=5
indicator(
title = “Kalman Hull Supertrend [BackQuant]”,
shorttitle = “Kalman Hull ST [BackQuant]”,
overlay=true,
precision = 2,
format = format.price,
timeframe = “”,
timeframe_gaps = true
)
// Define User Inputs
series float pricesource = input.source(close, “Kalman Price Source”, group = “Calculation”)
simple float measurementNoise = input.float(3.0, title=”Measurement Noise”, group = “Calculation”, tooltip = “Lookback Period/ Calculation Length”, step = 1.0)
simple float processNoise = input.float(0.01, title=”Process Noise”, step = 0.01, group = “Calculation”)
simple int atrPeriod = input.int(12, “ATR Period”, group = “Supertrend”, inline = “ST”)
simple float factor = input.float(1.7, “Factor”, group = “Supertrend”, inline = “ST”, step = 0.01)
simple bool showkalman = input.bool(true, “Show Supertrend on chart?”, group = “UI Settings”)
simple bool paintCandles = input.bool(true, “Paint candles according to Trend?”, group = “UI Settings”)
simple bool showlongshort = input.bool(true, “Show Long and Short Signals { + }”, group = “UI Settings”)
color longColor = input.color(#33ff00, “Long Color”, group = “UI Settings”, inline = “Col”)
color shortColor = input.color(#ff0000, “Short Color”, group = “UI Settings”, inline = “Col”)
/////////////////////////////////////////////////////////////// © BackQuant ///////////////////////////////////////////////////////////////
// Kalman Price Filter Function
N = 5
var float[] stateEstimate = array.new_float(N, na)
var float[] errorCovariance = array.new_float(N, 100.0)
f_init(series float pricesource) =>
if na(array.get(stateEstimate, 0))
for i = 0 to N-1
array.set(stateEstimate, i, pricesource)
array.set(errorCovariance, i, 1.0)
f_kalman(series float pricesource, float measurementNoise) =>
// Prediction Step
predictedStateEstimate = array.new_float(N)
predictedErrorCovariance = array.new_float(N)
for i = 0 to N-1
array.set(predictedStateEstimate, i, array.get(stateEstimate, i)) // Simplified prediction
array.set(predictedErrorCovariance, i, array.get(errorCovariance, i) + processNoise)
kalmanGain = array.new_float(N)
for i = 0 to N-1
kg = array.get(predictedErrorCovariance, i) / (array.get(predictedErrorCovariance, i) + measurementNoise)
array.set(kalmanGain, i, kg)
array.set(stateEstimate, i, array.get(predictedStateEstimate, i) + kg * (pricesource – array.get(predictedStateEstimate, i)))
array.set(errorCovariance, i, (1 – kg) * array.get(predictedErrorCovariance, i))
array.get(stateEstimate, 0)
f_init(pricesource)
kalmanFilteredPrice = f_kalman(pricesource, measurementNoise)
/////////////////////////////////////////////////////////////// © BackQuant ///////////////////////////////////////////////////////////////
// Hull Moving Average Function with Kalman instead of Weighted Moving Average
KHMA(_src, _length) =>
f_kalman(2 * f_kalman(_src, _length / 2) – f_kalman(_src, _length), math.round(math.sqrt(_length)))
// Return
kalmanHMA = KHMA(pricesource, measurementNoise)
/////////////////////////////////////////////////////////////// © BackQuant ///////////////////////////////////////////////////////////////
// Supertrend Function
supertrend(factor, atrPeriod, src) =>
atr = ta.atr(atrPeriod)
upperBand = src + factor * atr
lowerBand = src – factor * atr
prevLowerBand = nz(lowerBand[1])
prevUpperBand = nz(upperBand[1])
lowerBand := lowerBand > prevLowerBand or close[1] < prevLowerBand ? lowerBand : prevLowerBand
upperBand := upperBand prevUpperBand ? upperBand : prevUpperBand
int direction = na
float superTrend = na
prevSuperTrend = superTrend[1]
if na(atr[1])
direction := 1
else if prevSuperTrend == prevUpperBand
direction := close > upperBand ? -1 : 1
else
direction := close < lowerBand ? 1 : -1
superTrend := direction == -1 ? lowerBand : upperBand
[superTrend, direction]
// Call Function with Inputs
[superTrend, direction] = supertrend(factor, atrPeriod, kalmanHMA)
/////////////////////////////////////////////////////////////// © BackQuant ///////////////////////////////////////////////////////////////
// Conditional Trend
SupertrendLong = ta.crossunder(direction, 0)
SupertrendShort = ta.crossover(direction, 0)
var Trend = 0
if SupertrendLong and not SupertrendShort
Trend := 1
if SupertrendShort
Trend := -1
// Colouring
var barColour = #ffffff
if Trend == 1
barColour := longColor
if Trend == -1
barColour := shortColor
// Plotting
plot(
showkalman ? superTrend : na,
"Kalman Hull ST",
color = color.new(barColour, 40),
linewidth = 4
)
barcolor(paintCandles ? barColour : na)
// Long and Short Signals ()
plotshape(
showlongshort ? SupertrendLong : na,
offset=0,
title="Long",
text="",
style=shape.triangleup,
location=location.belowbar,
color=barColour,
textcolor=barColour,
size = size.tiny
)
plotshape(
showlongshort ? SupertrendShort: na,
offset=0,
title="Short",
text="",
style=shape.triangledown,
location=location.abovebar,
color=barColour,
textcolor=barColour,
size = size.tiny
)
// Alert Conditions
alertcondition(SupertrendLong, title="Kalman Hull ST Long", message="Kalman Hull ST Long {{exchange}}:{{ticker}}")
alertcondition(SupertrendShort, title="Kalman Hull ST Short", message="Kalman Hull ST Short {{exchange}}:{{ticker}}")
Ciao
Certo, posso analizzare il codice per tradurlo, ma devi lanciare la richiesta da qui:
https://www.prorealcode.com/free-code-conversion/
Ciao Ivan, ho provato ma non mi lascia caricare il post, non so per quale strano motivo…
Allora crei un nuovo post. Lo aspetterò.
Ciao Ivan, ho inserito il post con la richiesta di traduzione. Se puoi vedere, grazie!
perfect!