Stiffness indicator

Stiffness indicator

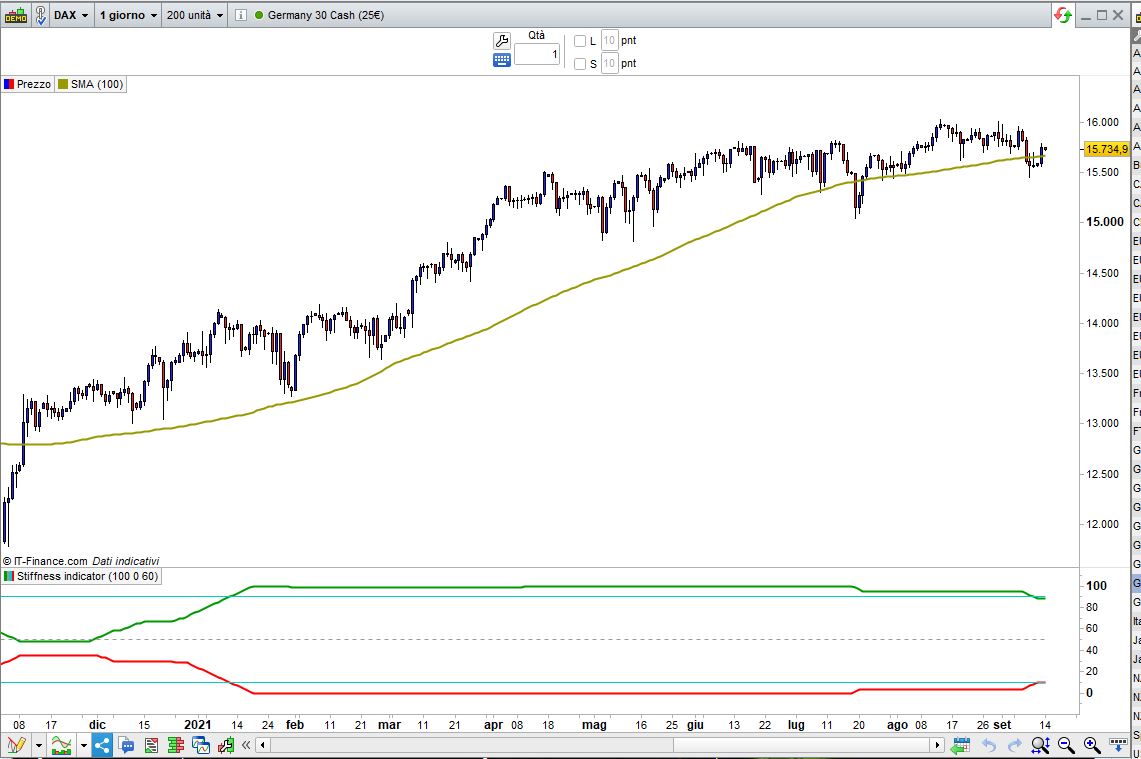
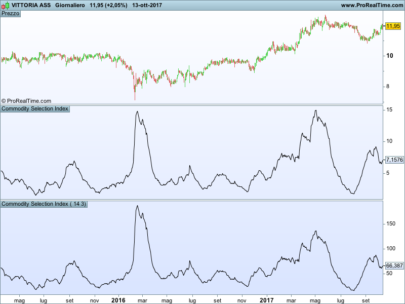
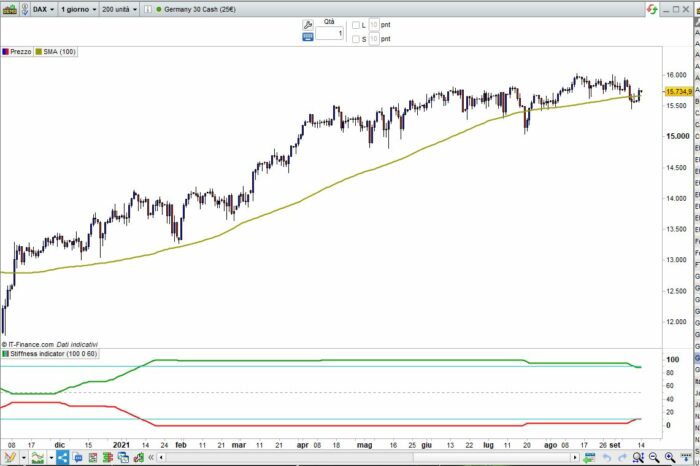
Stiffness indicator (by Markos Katsanos)

This indicator was first introduced in my November 2018 article in
Technical Analysis of STOCKS & COMMODITIES.

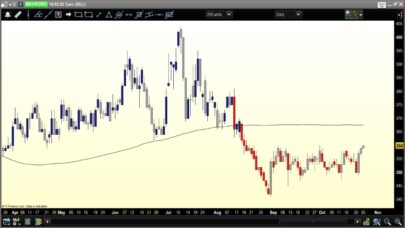
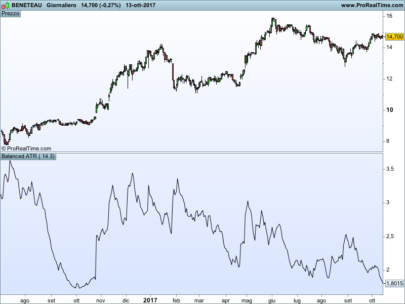
It basically attempts to recognize strong price trends by counting the number of times
that price was above the 100 day the moving average during the indicator period. The
premise is that the less times that price penetrates the moving average, the stronger
the trend is, suggesting less erratic prices in the future as well. I also introduced
a volatility threshold that excludes minimal penetrations of less than 0.2 standard deviations.

The default moving average is 100 days and the indicator period is 60 days.

Share this

Risk disclosure:

No information on this site is investment advice or a solicitation to buy or sell any financial instrument. Past performance is not indicative of future results. Trading may expose you to risk of loss greater than your deposits and is only suitable for experienced investors who have sufficient financial means to bear such risk.

ProRealTime ITF files and other attachments : How to import ITF files into ProRealTime platform?

PRC is also on YouTube, subscribe to our channel for exclusive content and tutorials
  1. Maxime Baudin • 09/14/2021 #

    Excellent timing indicator to confirm or deny entries in the market, congratulations Roberto! Very interesting in FX.

  2. aldtrading • 09/14/2021 #

    Thanks for your work. Would you mind explaining briefly how the volatility threshold works, I am having a hard time wrapping my head around that

  3. robertogozzi • 09/14/2021 #

    As the author said “I also introduced a volatility threshold that excludes minimal penetrations of less than 0.2 standard deviations”, lines 10-11 build the 0.2*STD buffer to get rid of minimal penetration, so that if the price is above or below the MA, but still within that 0.2 allowance, it’s not counted.

avatar
Register or

Likes

avatar avatar avatar avatar avatar avatar avatar avatar avatar avatar
Related users ' posts
Paul Thanks for posting. I was currently searching how to improve day-trading based on support an...
Jessar Könntest du im Forum etwas öffnen und später darüber zu sprechen?
arahussein Hi All, I am new to trading and i find this indicator very logicail! Hence my (dumb?) quest...
parthapersonal Great job Leo. Dear Zen83, how do you, "return them into the very last line"?
steve_ Hi! This thread is quite old, but let’s try… I’m new with Prorealcode and I’ve just di...
steve_ Hi! I've created a topic in french (translatable with Google function) here : https://www.p...
Marcel For those who are interested, I post trade opportunities with this indicator on Twitter. (@M...
swapping Thank you for sharing, best regards
Mirko Vaglio Interesting idea to bypass the limit of PRT about multiple timeframe, and I am just trying t...
Mirko Vaglio Looking a little bit more, now I understand what had to be absolutely obvious from the first...
Seb nice code! I'm trying to use your method to do a higher timeframe EMA, without success yet. ...
Tellie2015 tack ska du ha för dina delningar både här o twitter
Nicolas Better to download the file from the page and import it into your platform in order to not c...
marcov66 Hi Nicolas, thanks for sharing the VWAP Date Indicator. It is really powerful. Nevertheless,...
Nicolas Are you sure you are using the same exact date, hours, minutes, seconds for anchor?
Leo Hi all, I posted a new version of this indicator ( I just add arrows to spot the local maxi...
Trading_En_El_Ibex35 Muchas Gracias por compartir este interesante indicador. Un saludo
xavieralava hola gracias leo
Nicolas
8 years ago
julien1978 changing the trendDetectionLength setting does not seem to have any effect on the wave calcu...
arran i can't seem to get this indicator to work on forex pairs. it works great on indices etc. An...
Nicolas Indicator needs Volume, and there are no volumes with forex pairs with IG.
Nicolas https://www.prorealcode.com/topic/ayuda-screener-indicador-perfect-trend-line/#post-51291
Manu L. Bonjour Nicolas, suite a une de mes precedentes demande dans le forum indicateur, j'ai touv...
AntoGH C'est selon moi le meilleur indicateur, que j'ai vu, si vous trouvez mieux dîtes moi car dif...
avatar
Anonymous Found: just remove "T coloured(r,g,b) as "Top", Bo coloured(r,g,b) as "Bottom"... after return
darbes Hi I tried to use indicator in a strategy code. But backtesting is asking to define Signalb...
getset Hello, I like this indicator, it's small and very nice to use. So i changed the code a littl...
Jiacky mma = average[per,1](close) should be mma = average[per,1](close * 1000). Otherwise TDF will...
Lydia1948 Hi I really like this indicator - is it easy to change the colour of the blue dots to say g...
Nicolas Lines 23 and 24 are the Red and Blue value between 0 to 255, you can change the color of the...
vuduyet94@gmail.com Hi. I want Indicator Reversal Bars. I look in the library without seeing. hope the helping. ...
bolsatrilera Hi Nicolas, I have this version of the True Balance Power ,created by eykpunter on Tradingvi...
bolsatrilera and the code : REM TRUE BALANCE OF POWER // código original de eykpunter para la plataform...
Al Ok grazie Gabri
Paul thnx for posting. Combine it with Williams’ 3 bar trailing stop to create strategy!
gabri Paul, he uses the best day of the week to trade (he figured out the best day to enter, exit...
rafadonl2 is not taken into account in the procedure. It considers only if it is a doji or when candle...
Guibourse Okay thanks, just a question : how do you plot your two lines in the same window as price ? ...
rafadonl2 sorry, I don't understand your question. Indicator draws Heikin Ashi candle, not price cand...

Top