







Higher Timeframe RSI
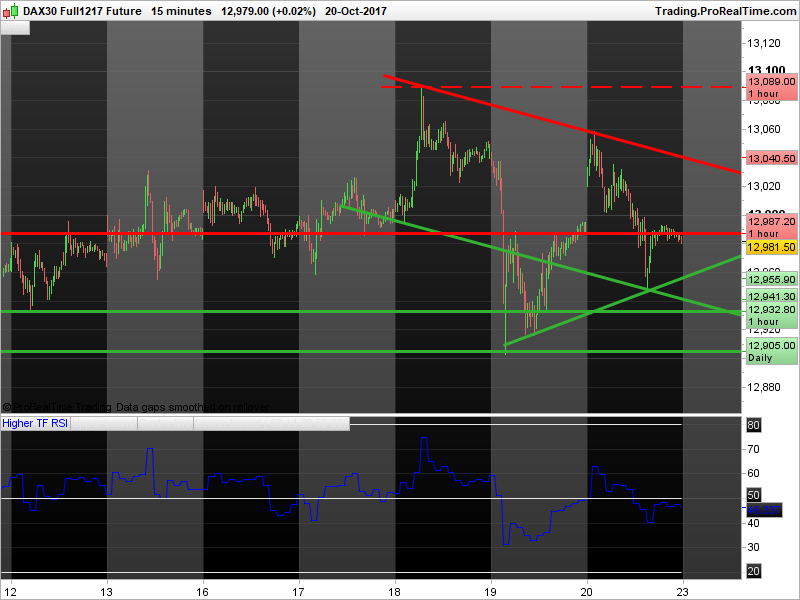
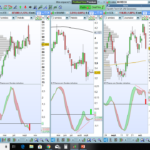
Does exactly what it says on the tin – gives the RSI value for a desired lookback period on a higher timeframe.
Only works up to timeframes of 2 hours (3 and 4 hour timeframes do not work as first bar of the day is sometimes a different duration, e.g. 1 or 2 hours, which messes up the calculations). Make sure obviously that the current timeframe is less than the specified higher timeframe.
// Chart timeframe:
IF Minute > 0 THEN
 IF Day = Day[1] THEN
  ChartTimeframe = Minute-Minute[1]
 ELSIF Day <> Day[1] THEN
  ChartTimeframe = Minute
 ENDIF
ELSIF Minute = 0 THEN
 IF Hour - Hour[1] = 1 THEN
  ChartTimeframe = (60-Minute[1])
 ELSIF Hour - Hour[1] > 1 THEN
  ChartTimeframe = (Hour-Hour[1]) * 60
 ENDIF
ENDIF

IF BarIndex > 0 AND BarIndex[1] > 0 AND ChartTimeFrame <> ChartTimeFrame[1] THEN
 ChartTimeFrame = ChartTimeFrame[1]
ENDIF

//
StartHour = 7

// No. of Closes to go back for each higher timeframe:
ResHTF = (Hour-StartHour) MOD MAX((HigherTimeFrame/60),1)

IF ChartTimeFrame > 0 THEN
 Calc1 = Minute MOD HigherTimeFrame
 Calc2 = Minute MOD ChartTimeFrame
 Pf1 = (ResHTF[1]*60) + (((Calc1-Calc2)/ChartTimeFrame)+1)[1]
ENDIF

// Higher TF RSI calculation:

IF Pf1 = HigherTimeFrame/ChartTimeFrame THEN
 Change = Close-Close[Pf1]
ELSE
 Change = 0
ENDIF

IF Pf1 = HigherTimeFrame/ChartTimeFrame AND Change >= 0 THEN
 Gain = Change
 GainMarker = 1
ELSE
 Gain = 0
 GainMarker = 0
ENDIF

IF Pf1 = HigherTimeFrame/ChartTimeFrame AND Change < 0 THEN
 Losss = ABS(Change)
 LossMarker = 1
ELSE
 Losss = 0
 LossMarker = 0
ENDIF

IF Pf1 = (HigherTimeFrame/ChartTimeFrame) THEN
 GainSMA = Summation[(ROUND(HigherTimeFrame/ChartTimeFrame)*(per-1))+Pf1](Gain)/Summation[(ROUND(HigherTimeFrame/ChartTimeFrame)*(per-1))+Pf1](GainMarker)
 LossSMA = Summation[(ROUND(HigherTimeFrame/ChartTimeFrame)*(per-1))+Pf1](Losss)/Summation[(ROUND(HigherTimeFrame/ChartTimeFrame)*(per-1))+Pf1](LossMarker)
ELSE
 GainSMA = 0
 LossSMA = 0
ENDIF


IF Pf1 = (HigherTimeFrame/ChartTimeFrame) AND BarIndex = (per*(HigherTimeFrame/ChartTimeFrame)) THEN
 AverageGain = (Gain+((per-1)*GainSMA[Pf1]))/per
 AverageLoss = (Losss+((per-1)*LossSMA[Pf1]))/per
ELSIF Pf1 = (HigherTimeFrame/ChartTimeFrame) AND BarIndex > (per*(HigherTimeFrame/ChartTimeFrame)) THEN
 AverageGain = (Gain+((per-1)*AverageGain[Pf1]))/per
 AverageLoss = (Losss+((per-1)*AverageLoss[Pf1]))/per
ELSE
 AverageGain = 0
 AverageLoss = 0
ENDIF

IF Pf1 = (HigherTimeFrame/ChartTimeFrame) THEN
 RS = AverageGain/AverageLoss
ELSE
 RS = 0
ENDIF

IF Pf1 = (HigherTimeFrame/ChartTimeFrame) THEN
 IF AverageLoss = 0 THEN
  MyRSI = 100
 ELSIF AverageLoss > 0 THEN
  MyRSI = 100-(100/(1+RS))
 ENDIF
ENDIF

UpperBound = ub
Centreline = cl
LowerBound = lb

RETURN MyRSI COLOURED(0, 0, 255) AS "Higher TF RSI", UpperBound COLOURED(0, 0, 0) AS "Upper bound", Centreline COLOURED(0, 0, 0) AS "Centre line", LowerBound COLOURED(0, 0, 0) AS "Lower bound"
// Gain COLOURED(0, 255, 0) AS "Gain", Losss COLOURED(255, 0, 0) AS "Loss", GainMarker COLOURED(0, 0, 0) AS "Gain marker", LossMarker COLOURED(0, 0, 0) AS "Loss marker", GainSMA COLOURED(0, 255, 0) AS "Gain SMA", LossSMA COLOURED(255, 0, 0) AS "Loss SMA", AverageGain COLOURED(0, 255, 0) AS "Average Gain", AverageLoss COLOURED(255, 0, 0) AS "Average Loss",
Comments
You must be logged in to post a comment.

Looking a little bit more, now I understand what had to be absolutely obvious from the first moment: the variable "per" (that I founded randomly) means period of calculation of RSI that is normaly set to 14 and has nothing to do with the timeframe. So for Rsi of 30/60m on 1m chart you have to put "HigherTimeFrame" at 30/60 but "per" is always 14, if you dont want for some reason to use non-standard Rsi on both timeframes. Re-thanks for the code.
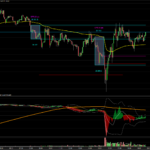
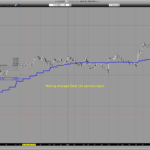
Interesting idea to bypass the limit of PRT about multiple timeframe, and I am just trying to plot 15 minutes Rsi on 1 minute Chart for the EURUSD. In the first moment, trying to convalidate the code on ProBuilder I received this message: «Define variables: highertimeframe, per, ub, cl, lb» and because I cannot understand enough the logic of the code and also some functions used in it I was uncertain how to define the variables. Looking a little bit more I could make the code partially working. Very obviously "ub" "cl" and "lb" stay for the bounds of the RSI, so I put them ub=70 (upper bound), cl=0 (center line) and lb=30 (lower bound). Also obviously "highertimeframe" stays for the higher frame: so, meaning to plot 15m RSI on the 1m chart I put highertimeframe=15: I was uncertain about the meaning of "per"... then, after trying some random values to plot something, I concluded it was meaning "period" and I wrote per=15 (also if, in this case, it was a not necessary variable yet existing "highertimeframe=15") Anyway plotting the indicator I could obtain values changing every 15 minutes with a line looking like Rsi. Controlling the values with the normal 15 minutes chart I saw sligtly bigger values.. So I tried per=14 (I don't know why..because I dont understand the calculation method) and the results are about identical to the normal Rsi15 with the problem that going back they are not correct sometime on the changing of the day. For what I controlled manually ,here is a table for these last days setting per=14 (remember the Rsi you see below the 15 minutes candle, for example, of 10:00 is the Rsi for the opening of the next candle (signed 10:15) and you see it on the 1minute chart below the 10:16 candle) EURUSD 15 minutes Chart___EURUSD 1 minute Chart Date____Time____Rsi 15m ____RsiHigher 1m 7 nov____10:00___14,85 ______14,85___(exact) 8 nov____00:30___73,94_______98,28___(out of scale) __________07:30___33.63_______31,05___(not exact) __________09:45___65:36_______65,72___(slightly exact) 9 nov____02:30___36.72_______36.72___(exact) __________08:15___75,75_______75,75___(exact) __________13:00___81,31_______81,31___(exact) __________15:15___40,28_______40,28___(exact) 10 nov___01:15___65,73_______65,73___(exact) __________09:15___31,13_______31,13____(exact) __________11:00___66,32_______66,32____(exact) __________16:30___70,19_______70,19____(exact) For what I see, also if there are problems going back, anyway, working on the current day, the indicator is ok and surely it will work also with 30m or 1h Rsi on 1 minute chart setting may be "HigerTimeFrame" 30/60 and, may be, "per" 29/59... Thanks for the code.

nice code! I'm trying to use your method to do a higher timeframe EMA, without success yet. Is this even possible?