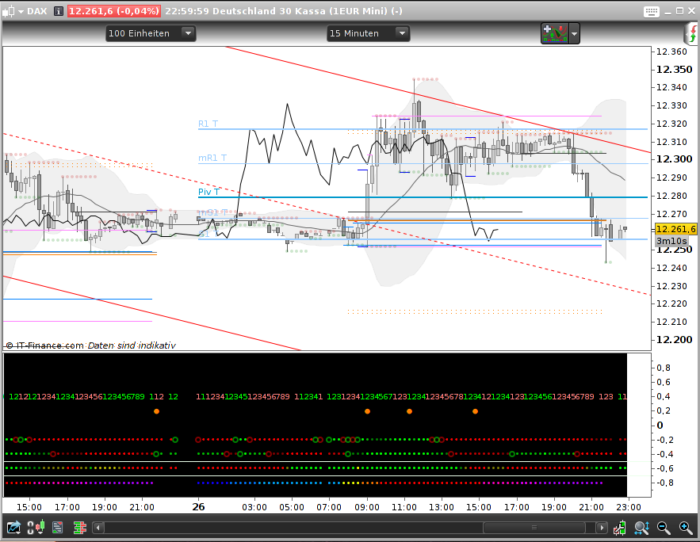
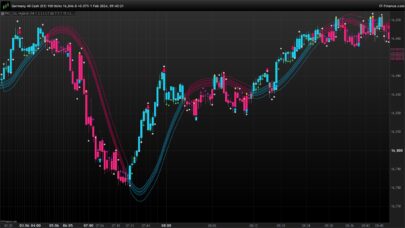
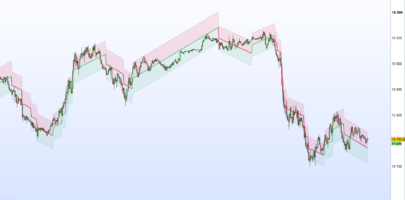
As I do not robot and my bar chart is already covered with all kind of lines – and additionally my screen size is limited – I needed a way to get rid of all those extra windows below the chart. So here is my Dot Board solution. It is modularized, so one can simply add another module line for own needs (well, I myself want some more).
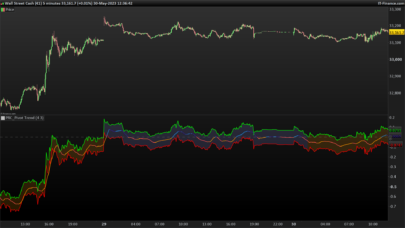
On the picture you see how it is built up: we go from the most general information at the bottom up to the very special information for a single candle.
- market session times
- squeeze or not
- accumulated trend
- (one way of) trading signal
- (this line is still unused)
- PopGun and candle marker – well I don’t use much candles
- swing teller
Maybe you can make use of it and want to add your own module to it – or you just want a standalone module (that’s a version I use for testing before I integrate it into my Dot Board).
|
1 2 3 4 5 6 7 8 9 10 11 12 13 14 15 16 17 18 19 20 21 22 23 24 25 26 27 28 29 30 31 32 33 34 35 36 37 38 39 40 41 42 43 44 45 46 47 48 49 50 51 52 53 54 55 56 57 58 59 60 61 62 63 64 65 66 67 68 69 70 71 72 73 74 75 76 77 78 79 80 81 82 83 84 85 86 87 88 89 90 91 92 93 94 95 96 97 98 99 100 101 102 103 104 105 106 107 108 109 110 111 112 113 114 115 116 117 118 119 120 121 122 123 124 125 126 127 128 129 130 131 132 133 134 135 136 137 138 139 140 141 142 143 144 145 146 147 148 149 150 151 152 153 154 155 156 157 158 159 160 161 162 163 164 165 166 167 168 169 170 171 172 173 174 175 176 177 178 179 180 181 182 183 184 185 186 187 188 189 190 191 192 193 194 195 196 197 198 199 200 201 202 203 204 205 206 207 208 209 210 211 212 213 214 215 216 217 218 219 220 221 222 223 224 225 226 227 228 229 230 231 232 233 234 235 236 237 238 239 240 241 242 243 244 245 246 247 248 249 250 251 252 253 254 255 256 257 258 259 260 261 262 263 264 265 266 267 268 269 270 271 272 273 274 275 276 277 278 279 280 281 282 283 284 285 286 287 288 289 290 291 292 293 294 295 296 297 298 299 300 301 302 303 304 305 306 307 308 309 310 311 312 313 314 315 316 317 318 319 320 321 322 323 324 325 326 327 328 329 330 331 332 333 334 335 336 337 338 339 340 341 342 343 344 345 346 347 348 349 350 351 352 353 354 355 356 357 358 359 360 361 362 363 364 365 366 367 368 369 370 371 372 373 374 375 376 377 378 379 380 381 382 383 384 385 386 387 388 389 390 391 392 393 394 395 396 397 398 399 400 401 402 403 404 405 406 407 408 409 410 411 412 413 414 415 416 417 418 419 420 421 422 423 424 425 426 427 428 429 430 431 432 433 434 435 436 437 438 439 440 441 442 443 444 445 446 447 448 449 450 451 452 453 454 455 456 457 458 459 460 461 462 463 464 465 466 467 468 469 470 471 472 473 474 475 476 477 478 479 480 481 482 483 484 485 486 487 488 489 490 491 492 493 494 495 496 497 498 499 500 501 502 503 504 505 506 507 508 509 510 511 512 513 514 515 516 517 518 519 520 521 522 523 524 525 526 527 528 529 530 531 532 533 534 535 536 537 538 539 540 541 542 543 544 545 546 547 548 549 550 551 552 553 554 555 556 557 558 559 560 561 562 563 564 565 566 567 568 569 570 571 572 573 574 575 576 577 578 579 580 581 582 583 584 585 586 587 588 589 590 591 592 593 594 595 596 597 598 599 600 601 602 603 604 605 606 607 608 609 610 611 612 613 614 615 616 617 618 619 620 621 622 623 624 625 626 627 628 629 630 631 632 633 634 |
// === Scalpers Dot Board // --- for PRT 10.3, July 2017, by AVT // --- we use one section for each indicator module and its dot line // --> for c&p Bullet • or Black Circle ● // square Bullet ▪ or Black Square ■ (halfwidth looks like 1st one) // heavy White Circle: or medium bold White Circle: // these make a good combination: Bullet and heavy White Circle • // arrows: ▲ ▼ ◄ ► (I would not use them, bad to see, color dot works better) // fade stepping: ([16, 32] [48, 64]) ([80, 96] [112, 128]) // ([144, 160] [176, 192]) ([208, 224] [240, 255]) // =========================== general section Begin ==================== // === Variables Begin // --- extern variables begin // ==> for users choice and quick turn on/off stuff make these extern // ==> background color for the chart, NO Alpha (we need Alpha for fading) // BGred = 0 // type integer // BGgreen = 0 // BGblue = 0 // ==> options to turn a line on/off all type boolean // this is the place where to add the ShowModule=1 for standalone tests //ShowSessions=1 // IndiNo=0 the begin of the bottom, many colors, no separator needed //ShowSqueeze=1 // IndiNo=1 bottom, above it a separator line //ShowTrendAccu = 1 // IndiNo=2 1 line above //ShowTradeSignals =1 // IndiNo=3 2 lines above // atm unused // IndiNo=4 3 lines above //ShowPG = 1 // IndiNo=5 4 lines above //ShowSwing=1 // IndiNo=6 5 lines above // --- variables for painting // ==> if you want these extern, type real // --- low line offset, that's where the lowest line is // with each new indicator we go one line up LowLineOffset = -0.8 // the y-axis position for the lowest line // --- add this number to IndiNo (starts with 0) to go one line up IndiLineOffsetAdd = 0.2 // how much to add for the next upper line // --- extern variables end // --- intern // --- check user background colors do not exeede allowed values BGred=min(BGred,255) BGred=max(BGred,0) BGgreen=min(BGred,255) BGgreen=max(BGred,0) BGblue=min(BGred,255) BGblue=max(BGred,0) // --- a "dirty test" to draw a separator line either in black or in white // depending on the users choosen background IF (BGred + BGgreen + BGblue) > 384 THEN SepLineRed = 0 SepLineGreen = 0 SepLineBlue = 0 ELSE SepLineRed = 235 SepLineGreen = 255 SepLineBlue = 235 ENDIF // --- fading out the color from 255=bright to 0=invisible for painting dots Fade0 = 255 Fade1 = 192 Fade2 = 128 Fade3= 64 //Fade4=0 // not used at the moment, uncomment if you need it // === Variables End // --- set background color for the window BACKGROUNDCOLOR(BGred,BGgreen,BGblue) // =========================== general section End ====================== // =========================== indicator section Begin ================== // ============ Indicator 0 Begin // === mark market session periods // --- see also: @ Noobywan https://www.prorealcode.com/topic/market-session/#post-40397 // --- refs: https://en.wikipedia.org/wiki/List_of_stock_exchange_opening_times // https://en.wikipedia.org/wiki/List_of_stock_exchanges IndiNo = 0 IF ShowSessions THEN // --- no need to calculate the line offset for painting if it's not used IndiLine = IndiLineOffsetAdd*IndiNo + LowLineOffset // --- conditions Session1 = (time>=080000 and time<090000 ) // 08:00-09:00 yellow EU pre Session2 = (time>=090000 and time<100000 ) // 09:00-10:00 orange EU Session3 = (time>=100000 and time<153000 ) // 10:00-15:30 red EU+GB Session4 = (time>=153000 and time<173000 ) // 15:30-17:30 magenta EU+GB+US Session5 = (time>=173000 and time<183000 ) // 17:30-18:30 darkmagenta GB+US Session6 = (time>=183000 and time<220000 ) // 18:30-22:00 violet US // --- note: this one paints overnight, so we need 22-00 and 00-2 // 22:00-02:00 darkblue ---- nothing, just to make it complete Session7 = (time>=220000 and time<000000 ) OR (time>=000000 and time<020000 ) Session8 = (time>=020000 and time<033000 ) // 02:00-03:30 blue JP/AU Session9 = (time>=033000 and time<080000 ) // 03:30-08:00 lightblue JP/AU+HK // --- painting // --- each if..endif on its own to make deleting easier IF Session1 THEN DRAWTEXT("•",barindex,IndiLine) coloured(255,255,0) // 08:00-09:00 yellow EU pre ENDIF IF Session2 THEN Drawtext("•",barindex,IndiLine) coloured(255,112,0) // 09:00-10:00 orange EU ENDIF IF Session3 THEN Drawtext("•",barindex,IndiLine) coloured(255,0,0) // 10:00-15:30 red EU+GB ENDIF IF Session4 THEN Drawtext("•",barindex,IndiLine) coloured(255,0,192) // 15:30-17:30 magenta EU+GB+US ENDIF IF Session5 THEN Drawtext("•",barindex,IndiLine) coloured(240,0,255) // 17:30-18:30 darkmagenta GB+US ENDIF IF Session6 THEN Drawtext("•",barindex,IndiLine) coloured(176,0,255) // 18:30-22:00 violet US ENDIF IF Session7 THEN Drawtext("•",barindex,IndiLine) coloured(16,0,255) // 22:00-02:00 darkblue ---- ENDIF IF Session8 THEN Drawtext("•",barindex,IndiLine) coloured(0,112,255) // 02:00-03:30 blue JP/AU ENDIF IF Session9 THEN Drawtext("•",barindex,IndiLine) coloured(0,160,255) // 03:30-08:00 lightblue JP/AU+HK ENDIF // --- draw a separator line, delete if not wanted/needed // --- explantion: at the end of IndiNo=1 DRAWHLINE(IndiLine+0.1) coloured(SepLineRed,SepLineGreen,SepLineBlue,Fade0) ENDIF // ============ Indicator 0 End // ============ Indicator 1 Begin // === Squeeze or not // --- cedits: @ LazyBear https://www.tradingview.com/script/nqQ1DT5a-Squeeze-Momentum-Indicator-LazyBear/ // @ ucsgear https://www.tradingview.com/script/0JQPULIU-UCS-Squeeze-Optimization/ // @ Nicolas https://www.prorealcode.com/prorealtime-indicators/ttm-squeeze-oscillator-price-version/ // --- take the normal squeeze indicator and let a Haikin Ashi optimized confirm the squeeze // Haikin Ashi not so noisy, so as long as HA says "no" we do no full bright color IndiNo = 1 IF ShowSqueeze THEN // --- calculate the line offset for painting IndiLine = IndiLineOffsetAdd*IndiNo + LowLineOffset // --- test values in a standalone version, I found KC(16/1.4) quite good BBlength=20 BBmult=2 KClength=16 KCmult=1.4 // --- calc and conditions if barindex >1 then HAClose = (open + high + low + close) /4 HAOpen = (HAOpen[1] + HAClose[1]) / 2 HAHigh = MAX( high,MAX(HAOpen,HAClose) ) HALow = MIN( low,MIN(HAOpen,HAClose) ) HAatr1 = abs(HAHigh - HAClose[1]) HAatr2 = abs(HAClose[1] -HALow) HAatr3 = abs(HAHigh - HALow) HAatr = max(HAatr1, max(HAatr2,HAatr3) ) endif // --- Bollinger Normal NormalBBbasis = average[BBlength](close) NormalBBdev = BBmult * Std[BBlength](close) NormalupperBB = NormalBBbasis + NormalBBdev NormallowerBB = NormalBBbasis - NormalBBdev // --- Bollinger HAoptimized OptiBBbasis = average[BBlength](HAclose) OptiBBdev = BBmult * Std[BBlength](HAclose) OptiupperBB = OptiBBbasis + OptiBBdev OptilowerBB = OptiBBbasis - OptiBBdev // --- Keltner Channel normal NormalKCma = average[KClength](close) NormalKCrangema = average[KClength](AverageTrueRange[KClength]) NormalupperKC = NormalKCma + NormalKCrangema * KCmult NormallowerKC = NormalKCma - NormalKCrangema * KCmult // --- Keltner Channel HAoptimized OptiKCma = average[KClength](HAclose) OptiKCrangema = average[KClength](HAatr[KClength]) OptiupperKC = OptiKCma + OptiKCrangema * KCmult OptilowerKC = OptiKCma - OptiKCrangema * KCmult // --- Squeeze on or off normal NormalsqzOn = (NormallowerBB > NormallowerKC) AND (NormalupperBB < NormalupperKC) NormalsqzOff = (NormallowerBB < NormallowerKC) AND (NormalupperBB > NormalupperKC) NormalnoSqz = (NOT NormalsqzOn) AND (NOT NormalsqzOff) // --- Squeeze on or off HAoptimized OptisqzOn = (OptilowerBB > OptilowerKC) AND (OptiupperBB < OptiupperKC) OptisqzOff = (OptilowerBB < OptilowerKC) AND (OptiupperBB > OptiupperKC) OptinoSqz = (NOT OptisqzOn) AND (NOT OptisqzOff) // --- painting if NormalsqzOn then // having a squeeze means wait with trendfollow, rangescalp =red FadeState=Fade0 // normal says "squeeze", bright red if OptinoSqz then // HA says "no", go one step darker FadeState=Fade1 elsif OptisqzOff then // HA says "squeeze? that thing is released!", one darker FadeState=Fade2 endif DRAWTEXT("•",barindex,IndiLine,monospaced,standard,11) coloured(255,0,0,FadeState) endif if NormalsqzOff then // squeeze is released, so action trendfollow allowed =green FadeState=Fade0 // normal says "released, follow trend", bright green if OptinoSqz then // HA says "wait with your release", one step darker green FadeState=Fade1 elsif OptisqzOn then // HA says "error, full squeeze", another step darker FadeState=Fade2 endif DRAWTEXT("•",barindex,IndiLine,monospaced,standard,11) coloured(0,255,0,FadeState) endif // --- normal calculation: this is an addition in LazyBear and ucsgear version if NormalnoSqz then // no Squeeze, yellow FadeState=Fade1 if OptisqzOff then // HA has released go lighter FadeState=Fade0 elsif OptisqzOn then // HA has squeezed, go darker FadeState=Fade2 endif DRAWTEXT("•",barindex,IndiLine,monospaced,standard,11) coloured(255,255,0,FadeState) endif // --- to separate the squeeze indicator from all the others, draw a separator line // we do this because we use the same colors as those for trend and acting signals // and we do NOT want this line to be mistaken as a trend line // ==> note: we use fontsize=11 and a line stepping of 0.2, // therefore we put the separator line into the middle, thats line + 0.1 DRAWHLINE(IndiLine+0.1) coloured(SepLineRed,SepLineGreen,SepLineBlue,Fade0) ENDIF // ============ Indicator 1 End // ============ Indicator 2 Begin // === Trenddetection accumulated SMA, default MACD and default SAR // --- credits: @ Ciccio https://www.prorealcode.com/prorealtime-indicators/candlesticks-patterns-indicator/ // ==> Candle signals depend on trend, IF Show__ just limits painting, not calculation // that's just in case you want the candle signals as indicator later IndiNo = 2 // --- calc and conditions maFastPeriod = 7 maSlowPeriod = 21 maFast = average[maFastPeriod,0](close) maSlow = average[maSlowPeriod,0](close) // --- 1. 2 EMA values MAup = ( maFast>=maSlow ) MAdown = ( maFast<maSlow ) // --- 2. default value MACD MACDup = ( MACDline[12,26,9](close)>0 AND MACD[12,26,9](close)>0 ) MACDdown = ( MACDline[12,26,9](close)<0 AND MACD[12,26,9](close)<0 ) // --- 3. default value Parabolic SAR SARup = ( SAR[0.02,0.02,0.2]<low ) SARdown = ( SAR[0.02,0.02,0.2]>high ) // --- conditions: we have 5 trend states IF maFast CROSSES OVER maSlow THEN // cross up, uptrend might begin, slight green TRENDstate = 1 ELSIF MAup THEN // fast above, uptrend, bright green TRENDstate = 2 ELSIF maFast CROSSES UNDER maSlow THEN // cross down, downtrend might begin, slight red TRENDstate = -1 ELSIF MAdown THEN // fast below, downtrend, bright red TRENDstate = -2 ELSE TRENDstate = 0 // forgot something or not enough data to calc ENDIF // ==> this is the IF Show___ which is usually at the beginning IF ShowTrendAccu THEN // --- in which line to paint our dots IndiLine = IndiLineOffsetAdd*IndiNo + LowLineOffset // --- intensity of trend depending on how many of the indicators say Trend is up/down // we start with Fade2 and for each one confirming we go one step brighter // !!! default MA is the first one to cry TREND! IF MAup THEN // first on, think we have a trend => bit green FadeState = Fade2 IF SARup THEN // you are right => bit more green FadeState = Fade1 IF MACDup THEN // got it too, let's go => bright green FadeState = Fade0 ENDIF ENDIF ENDIF IF MAdown THEN // same play here FadeState = Fade2 IF SARdown THEN FadeState = Fade1 IF MACDdown THEN FadeState = Fade0 ENDIF ENDIF ENDIF IF TRENDstate = 2 THEN // fast above slow, strong up: bright green DRAWTEXT("•",barindex,IndiLine,monospaced,standard,11) coloured(0,255,0,FadeState) ELSIF TRENDstate = 1 THEN // fast crossing up, begins up: fade green DRAWTEXT("",barindex,IndiLine,monospaced,standard,11) coloured(0,255,0,Fade2) ELSIF TRENDstate = -1 THEN // fast crossing down, begins down: fade red DRAWTEXT("",barindex,IndiLine,monospaced,standard,11) coloured(255,0,0,Fade2) ELSIF TRENDstate = -2 THEN // fast below slow, strong down: bright red DRAWTEXT("•",barindex,IndiLine,monospaced,standard,11) coloured(255,0,0,FadeState) ENDIF ENDIF // ============ Indicator 2 End // ============ Indicator 3 // === Tradingsignals OBOS+STOCH+RSI, enter STOCHcross if RSI agrees, exit Price crosses TEMA // --- sma(50 is quite good for trendtrading too) IndiNo = 3 IF ShowTradeSignals THEN // --- the line in which to paint our dots IndiLine = IndiLineOffsetAdd*IndiNo + LowLineOffset // --- calc and conditions // --- trade enter indicator, this is also our trendline indicator temaPeriod = 50 // 21 temaVal = tema[temaPeriod](close) // tema trend for painting the main line temaUp = ( close[0] > temaVal ) temaDown = ( close[0] < temaVal ) // tema signals for short or long temaEnterLong = ( close[0] CROSSES OVER temaVal ) temaEnterShort = ( close[0] CROSSES UNDER temaVal ) // --- trade exit indicator rsiPeriod = 10 // is for German DAX in m5 a typical Limit rsiVal = rsi[rsiPeriod](close) //rsiUp = ( rsiVal > rsiVal[1] ) rsiDefaultUpper = 70 rsiDefaultLower = 30 RSIupperBorder1 = 80 RSIupperBorder2 = 90 RSIlowerBorder1 = 20 RSIlowerBorder2 = 10 //rsiDownCross = ( rsiVal CROSSES UNDER rsiDefaultUpper ) //rsiUpCross = ( rsiVal CROSSES OVER rsiDefaultLower ) rsiExitLong = ( rsiVal CROSSES UNDER rsiDefaultUpper ) //rsiExitShort = ( rsiVal CROSSES OVER rsiDefaultLower ) // rsi overbought, oversold for painting the fades into the main line rsiOB1 = ( rsiVal >= rsiDefaultUpper AND rsiVal < RSIupperBorder1 ) // begin overbought rsiOB2 = ( rsiVal >= RSIupperBorder1 AND rsiVal < RSIupperBorder2 ) // exeede overbought rsiOB3 = ( rsiVal >= RSIupperBorder2 ) // extrem overbought rsiOS1 = ( rsiVal <= rsiDefaultLower AND rsiVal > RSIlowerBorder1 ) rsiOS2 = ( rsiVal <= RSIlowerBorder1 AND rsiVal > RSIlowerBorder2 ) rsiOS3 = ( rsiVal <= RSIlowerBorder2 ) // --- painting the color line LongTradeStart = temaEnterLong // state=3 LongTradeKeep = temaUp // state=2 LongTradeExit = ( (temaUp AND rsiExitLong) OR temaEnterShort ) // state=1 //TradeWait = ( temaDown AND rsiVal ) // state=0 ShortTradeStart = temaEnterShort ShortTradeKeep = temaDown //ShortTradeExit = ( (temaDown AND rsiExitShort) OR temaEnterLong ) // --- we know 3 states: longstart, longend=shortstart, shortstart, (shortend=longstart) IF LongTradeStart THEN // exit short + enter long TRENDstate = 2 FadeState = Fade2 ELSIF LongTradeKeep THEN // stay long TRENDstate = 1 FadeState = Fade0 // tema + rsi up, complete green IF rsiOB1 THEN FadeState = Fade1 // rsi says overbought, careful, take one green off ELSIF rsiOB2 THEN FadeState = Fade2 // rsi more overbought, may now change, another green off ELSIF rsiOB3 THEN FadeState = Fade3 // rsi extreme overbought, forget long, another green off ENDIF ELSIF LongTradeExit AND ShortTradeStart THEN // exit long + enter short TRENDstate = -1 FadeState = Fade2 ELSIF ShortTradeKeep THEN // stay short TRENDstate = -2 FadeState = Fade0 // tema + rsi down, complete red IF rsiOS1 THEN FadeState = Fade1 // rsi says oversold, careful, take one red off ELSIF rsiOS2 THEN FadeState = Fade2 // rsi more oversold, may now change, another red off ELSIF rsiOS3 THEN FadeState = Fade3 // rsi extreme oversold, forget short, another red off ENDIF ELSE // no action allowed TRENDstate = 0 ENDIF // --- painting IF TRENDstate = 2 THEN // enter long, green DRAWTEXT("",barindex,IndiLine,monospaced,standard,11) coloured(0,255,0,FadeState) ELSIF TRENDstate = 1 THEN // stay long, green DRAWTEXT("•",barindex,IndiLine,monospaced,standard,11) coloured(0,255,0,FadeState) ELSIF TRENDstate = -1 THEN // exit long + enter short, red DRAWTEXT("",barindex,IndiLine,monospaced,standard,11) coloured(255,0,0,FadeState) ELSIF TRENDstate = -2 THEN // stay short, red DRAWTEXT("•",barindex,IndiLine,monospaced,standard,11) coloured(255,0,0,FadeState) ELSE // =0 wait DRAWTEXT("•",barindex,IndiLine,monospaced,standard,11) coloured(255,128,0,FadeState) ENDIF ENDIF // ============ Indicator 3 End // ============ Indicator 4 Begin // ============ Indicator 4 End // ============ Indicator 5 Begin // === Popgun Marker and Candles // !!! important for candles: leave the calculation of IndiNo = 2 in // candles depend on trend IndiNo = 5 IF ShowPG THEN // --- the line in which to paint our dots IndiLine = IndiLineOffsetAdd*IndiNo + LowLineOffset // --- calc for candles, some outcommented cause my candles don't need them body=close-open abody=abs(body) if range>0 then ratio=abody/range else ratio=0 endif middle=(open+close)/2 // ==> outcomment the following if you add more candle patterns and they need them //bodytop=max(open, close) //bodybottom=min(open, close) //shadowtop=high-bodytop //shadowbottom=bodybottom-low longcandle= (ratio>0.6) // --- conditions Popgun=(high[0]>high[1] AND low[0]<low[1] AND high[1]<high[2] AND low[1]>low[2]) // --- only want PGs painted from timeframe m15 and higher and only within 8-22 // --- only PGs from m15 upward are tradable IF (time>=080000 AND time<=220000) THEN // --- get times of the last 4 candles, get difference between 2 candles // --- we must compare because once in an hour due to maths the result is wrong Result0=time[0]-time[1] Result1=time[1]-time[2] Result2=time[2]-time[3] // --- if 2 results are identical, that's the right one IF Result0=Result1 OR Result0=Result2 THEN // 2 identical results IF Result0>0 AND Result0<1500 THEN // m30=0 m15=1500 PGforbidden=1 // less than m15, greater m30=0 ENDIF ELSIF Result1=Result2 THEN // 2 identical results, do same as above IF Result0>0 AND Result0<1500 THEN // m30=0 m15=1500 PGforbidden=1 // less than m15, greater m30=0 ENDIF ENDIF ENDIF // --- candle detection: // --- BullishThreeLineStrike in bullmarket after downreversal Bull3LineStrike=(body[3]>0 and body[2]>0 and body[1]>0 and body<0 and longcandle[3] and longcandle[2] and longcandle[1] and close[2]>close[3] and close[1]>close[2] and open>close[1] and close<open[3]) // --- ThreeBlackCrows in bearmarket after up breakout ThreeBlackCrows=(body[2]<0 and body[1]<0 and body<0 and longcandle[2] and longcandle[1] and longcandle and low[1]<low[2] and low<low[1] and close[1]<close[2] and close<close[1] and open[1]<open[2] and open[1]>close[2] and open<open[1] and open>close[1]) // --- EveningStar in downtrend after upreversal EveStar=(body[2]>0 AND body<0 and longcandle[2] and open[1]>close[2] and open<close[1] and ratio[1]<0.3 and abody[1]<abody[2] and abody[1]<abody and high[1]>high and high[1]>high[2] and low[1]>open[2] and low[1]>close) // --- special PiercingLine in down RETRACEMENT (only retracement) PierceLine=(body[1]<0 and body>0 and longcandle[1] and longcandle and open<low[1] and close>middle[1] and close<open[1]) // --- painting IF TrendState = 2 AND Bull3LineStrike THEN DRAWTEXT("●",barindex,IndiLine,monospaced,standard,11) coloured(0,255,0,Fade0) // green ELSIF TrendState = 2 AND ThreeBlackCrows THEN DRAWTEXT("●",barindex,IndiLine,monospaced,standard,11) coloured(255,0,0,Fade0) // red ELSIF TrendState = 2 AND EveStar THEN DRAWTEXT("●",barindex,IndiLine,monospaced,standard,11) coloured(255,0,0,Fade0) // red ELSIF TrendState = -1 AND PierceLine THEN DRAWTEXT("●",barindex,IndiLine,monospaced,standard,11) coloured(0,255,0,Fade0) // green ENDIF // --- popgun last, that's the most important for me // ==> if candles are more important for you, put this before the candle painting IF Popgun AND (NOT PGforbidden) THEN DRAWTEXT("●",barindex,IndiLine,monospaced,standard,11) coloured(255,128,0,Fade0) // orange, no direction ENDIF ENDIF // ============ Indicator 5 End // this one should be the top one because it is the most special // =========================== indicator section Begin ================== // ============ Indicator 6 Begin // === PRC_swing teller live count2 // --- credits: @ Nicolas https://www.prorealcode.com/topic/rewrite-code-to-prorealtime-code/ // --- note: we use the smallest font size in case fails should be shown IndiNo=6 IF ShowSwing THEN ShowFails=0 // =1 yes -> we need 2 lines, =0 no -> we need one line // --- variables for painting IndiLine = IndiLineOffsetAdd*IndiNo + LowLineOffset // --- if we want to see the counting fail marks, we need 2 lines // because fail marker and new counter have the same bar position IF ShowFails THEN IndiUp=IndiLine+0.05 // put the ups in upper line part IndiDown=IndiLine-0.05 // put the down in lower line part ELSE IndiUp=IndiLine // up counter numbers in one line IndiDown=IndiLine // down counter numbers in same line ENDIF // --- to make changes in color easier we set variables for the colors // this way we don't have to change all painting lines // --- naming: [R(ed)|G(reen)|B(lue)][u(p)|d(own)][c(ounting)|f(ailed)] // --- up counting and fails Ruc=0 // counter Guc=255 // counter Buc=0 // counter Ruf=0 // fail Guf=128 // fail Buf=0 // fail // --- down counting and fails Rdc=255 // counter Gdc=128 // counter Bdc=128 // counter Rdf=255 // fail Gdf=0 // fail Bdf=0 // fail // --- calc and painting Lb=4 // --- up swing if UpCount>0 and Close>Close[Lb] then DownCount=0 UpCount=UpCount+1 // --- paintig the up counts following No. 1 if UpCount=2 then DRAWTEXT("2",barindex,IndiUp,Monospaced,Standard,10) coloured(Ruc,Guc,Buc) elsif UpCount=3 then DRAWTEXT("3",barindex,IndiUp,Monospaced,Standard,10) coloured(Ruc,Guc,Buc) elsif UpCount=4 then DRAWTEXT("4",barindex,IndiUp,Monospaced,Standard,10) coloured(Ruc,Guc,Buc) elsif UpCount=5 then DRAWTEXT("5",barindex,IndiUp,Monospaced,Standard,10) coloured(Ruc,Guc,Buc) elsif UpCount=6 then DRAWTEXT("6",barindex,IndiUp,Monospaced,Standard,10) coloured(Ruc,Guc,Buc) elsif UpCount=7 then DRAWTEXT("7",barindex,IndiUp,Monospaced,Standard,10) coloured(Ruc,Guc,Buc) elsif UpCount=8 then DRAWTEXT("8",barindex,IndiUp,Monospaced,Standard,10) coloured(Ruc,Guc,Buc) elsif UpCount=9 then DRAWTEXT("9",barindex,IndiUp,Monospaced,Standard,10) coloured(Ruc,Guc,Buc) last9bar=barindex // reset count UpCount=0 endif // up swing fail elsif UpCount>0 and Close<Close[Lb] then // --- we have enough space, so we can show the fails if ShowFails then // --- mark if an up swing failed DRAWTEXT("F",barindex,IndiUp,Monospaced,Standard,10) coloured(Ruf,Guf,Buf) endif // reset count UpCount=0 endif // --- down swing if DownCount>0 and Close<Close[Lb] then UpCount=0 DownCount=DownCount+1 // --- paint the down counts folling No. 1 if DownCount=2 then DRAWTEXT("2",barindex,IndiDown,Monospaced,Standard,10) coloured(Rdc,Gdc,Bdc) elsif DownCount=3 then DRAWTEXT("3",barindex,IndiDown,Monospaced,Standard,10) coloured(Rdc,Gdc,Bdc) elsif DownCount=4 then DRAWTEXT("4",barindex,IndiDown,Monospaced,Standard,10) coloured(Rdc,Gdc,Bdc) elsif DownCount=5 then DRAWTEXT("5",barindex,IndiDown,Monospaced,Standard,10) coloured(Rdc,Gdc,Bdc) elsif DownCount=6 then DRAWTEXT("6",barindex,IndiDown,Dialog,Standard,10) coloured(Rdc,Gdc,Bdc) elsif DownCount=7 then DRAWTEXT("7",barindex,IndiDown,Monospaced,Standard,10) coloured(Rdc,Gdc,Bdc) elsif DownCount=8 then DRAWTEXT("8",barindex,IndiDown,Monospaced,Standard,10) coloured(Rdc,Gdc,Bdc) elsif DownCount=9 then DRAWTEXT("9",barindex,IndiDown,Monospaced,Standard,10) coloured(Rdc,Gdc,Bdc) last9bar=barindex // reset count DownCount=0 endif // down swing fail elsif DownCount>0 and Close>Close[Lb] then // --- we have enough space, so we can show the fails if ShowFails then // --- mark a failed down swing DRAWTEXT("F",barindex,IndiDown,Monospaced,Standard,10) coloured(Rdf,Gdf,Bdf) endif // reset count DownCount=0 endif // --- begin swing Up if UpCount=0 and barindex-last9bar>1 then r = close[Lb] if close>r then UpCount=1 DownCount=0 // draw up counter No. 1 DRAWTEXT("1",barindex,IndiUp,Monospaced,Standard,10) coloured(Ruc,Guc,Buc) endif endif // --- begin swing Down if DownCount=0 and barindex-last9bar>1 then r = close[Lb] if close<r then DownCount=1 UpCount=0 // draw down counter No. 1 DRAWTEXT("1",barindex,IndiDown,Monospaced,Standard,10) coloured(Rdc,Gdc,Bdc) endif endif ENDIF // ============ Indicator 6 End // template // ============ Indicator x Begin //IndiNo = x //IF Show____ THEN // --- in which line to paint our dots //IndiLine = IndiLineOffsetAdd*IndiNo + LowLineOffset // --- calc and conditions // --- painting //ENDIF // ============ Indicator x End // =========================== indicator section End ==================== // =========================== End marker, nothing below this line ====== RETURN // === Program End |
Share this
No information on this site is investment advice or a solicitation to buy or sell any financial instrument. Past performance is not indicative of future results. Trading may expose you to risk of loss greater than your deposits and is only suitable for experienced investors who have sufficient financial means to bear such risk.
ProRealTime ITF files and other attachments :
Find other exclusive trading pro-tools on ![]()
PRC is also on YouTube, subscribe to our channel for exclusive content and tutorials


Bravo ! Amazing !
Any way to make circles/bullets bigger on the screen ?
Big thanks !
yep, save the original first, incase your experiment fails.
open the indicator
use something saying “modify indicator” or alike
use the replacement tool (the magnifiying lens)
copy standard,11
cursor into the search area, then do CTRL+V to copy it into the search area
do the same in the replace area
in the replace area substitute 11 by for example 16
hit replace all
Swing counter is using Standard,10 note: capital letter S
For the market sessions there’s in the beginning of the code a section for copy and paste of symbols, if you want for example a square instead of a dot… well I guess, once you are in the code you will have your fun playing with it.
Hope that will do the job for youl
Thanks AVT. Your tip to make circles bigger works perfectly !
Wow, that is some great work!! Goo job!!
wow thats a lot of work
Great! Thanks!
@AVT brilliant idea, love the way you are thinking outside the box of usual PRT limitations here! Can you maybe provide us with one or two typical examples of setups (referring to your indicator lines) that you consider high probability entry points?
For Example:
1. Session = Magenta
2. Squeeze = Dark Red/Green
3. Trend = Dark Red/Green
4. N/A
5. N/A
6. PopGun Present
7. Swing after count > 4
@juanj
I have to think about your example first – weekend, so brain is most time off 😉
Will come back to that.
Ok, best is if I show you what I did on Friday
-. I trade indices, mainly DAX (but I do poach also in other european areas, FTSE, CAC, SMI ..)
-. means as soon as US enters I am off – or at least very careful cause DOW is too crazy for me
-. for the Session it means yellow till red (but I don’t need the session module, I know my times)
0. check what events we have today which might interfere
1. I take the h1 chart and and get an overview of the lines
> squeeze is green -> follow the trend
> trend is red -> general orientation for now short
> previous strategy short but already darker, so not so strong any longer
> swingteller 2nd green
2. means in all: orientation short, but expect the first movement to go up
3. I take m5 and look at the same
> squeeze green -> follow trend -> trend green -> up, swingteller 3rd green, that’s still ok for long
4. I take m1 and look the same
> squeeze green, trend green but swingteller 9 green (that’s the last green) -> wait
5. with the first green on the signal line I went long and with the exit signal I got off (+10p)
6. pause, why did I not enter short (my orientation was short)?
> because m5 is long and best chances are when m5 goes the same direction as m1
7. started short at 8:56
> squeeze green -> follow trend ->m1 already read, signal even earlier but against m5 and m5 trend green
> swingteller with more red counts than green
> 8:56 trend m5 changes to red and m5 to dark green > this risk is ok
8. 9:06 exit nearly at bottom of m1 candle, why?
> cause it was a strong movement and ended at a line marked as possible return in my chart
> (additionally it was near a point where another strategy would go long)
– in all about +60p
So that is in detail how I deal with it: when squeeze line is green -> follow trend, what the trend is says the line above – remember it’s always better to have the next higher timeframe “on your side” – and avoid entering a trade if the swingteller has its last numbers cause that might turn into the other direction then.
And I don’t use only the DotBoard, I have a lot of lines in my chart telling me when “it’s enough”. The popgun marker is one of them with an aim marker, range markers another. Additionally I am originally a highspeed scalper (slow in, fast out, no regrets) and due to that I sometimes act completely against all signals – but NEVER, NEVER against moneymanagement rules.
I hope you got an idea how to use all the lines.
Do the session module work from anywhere in the world like it is, or do we need to adjust the time to align correctly? I’m in Stockholm/Sweden for example.
Great indicator! Thanks a lot!
My PRT is adjusted to use 24hours local time for everything. The times are for for European time, being CET+1 or UTC+2.
Sweden is the same time zone, even summertime seems the same Mar-Oct, so for you it should be no change.
But those times are hardcoded, means they must be adjusted to wherever you are.
To make that dynamically changing means timezone conversion based on UTC and additionally summer/wintertime adjustment (as UTC – as far as I rember, just too long ago that I did timeconversions – does not calculate with summer/wintertime changes); and honestly spoken, I don’t want to be the one to code that.
Hope that was what you needed.
Real Awesome, thank you man!
no entiendo como funciana este indicador, por favor alguien podria explicar como utilizarlo???
No se trata de un solo indicador, pero cada linea muestra otra información,
de abajo hacia arriba es más especial:
1. tiempos de mercados
2. “Squeeze” o no
3. tendencia compuesto
4. una forma de señal de trading
5. linea sin usar
6. PopGun y vela marcador
7. numeros del Swingteller
-. Apriete línea verde-> siguir la tendencia-> tendencia línea verde = Long
-. línea apriete roja-> rango trading
-. Es mejor si la unidad de padres del tiempo tiene mismas señales
Your indicator is interesting, I evaluated its relevance with the squeeze to detect the phases of stagnation on the
Fearsome in MultiTimeframe, it could give ideas for the algorithm.
I have a lot, congratulations.