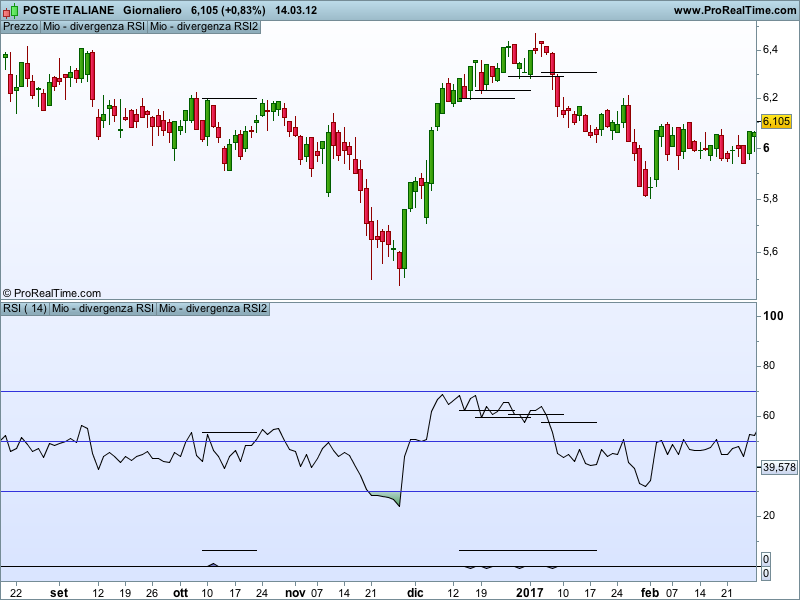
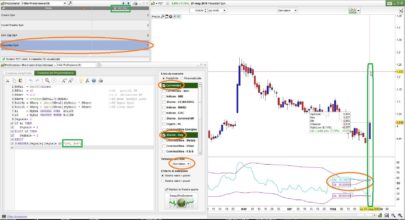
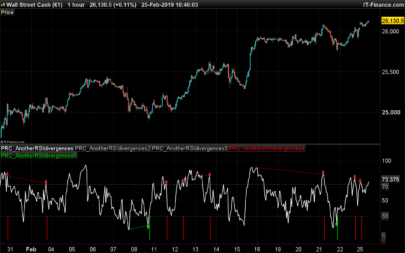
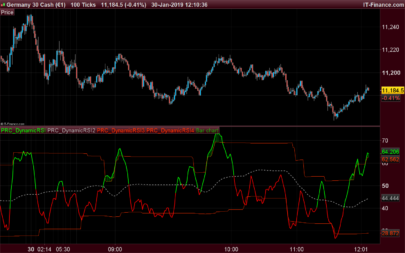
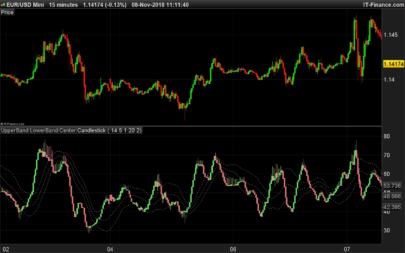
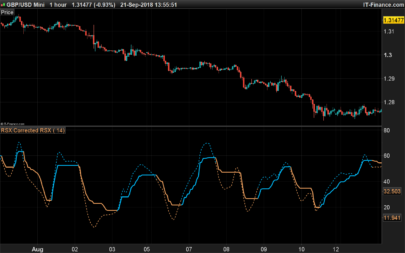
This indicator finds the divergences between price and RSI and draw a segment (on price on RSI or both) at the highest value between the two peaks (for bullish divergencies) or at the lowest value reached between the two bottoms (for bearish divergencies). I use this levels as entry for long/short positions. Only when the price close above or under this levels I have an entry signal. On the picture is hard to see the segments because PRT doesn’t allow to change the tickness and the style.
Blue skies
|
1 2 3 4 5 6 7 8 9 10 11 12 13 14 15 16 17 18 19 20 21 22 23 24 25 26 27 28 29 30 31 32 33 34 35 36 37 38 39 40 41 42 43 44 45 46 47 48 49 50 51 52 53 54 55 56 |
//Variables a=rsi[14](close) once RefCloseDownOld=0 once RefRSIDownOld=0 once RefCloseUpOld=0 once RefRSIUpOld=0 once BarBullOld=0 once BarBearOld=0 //Conditions to identify max and min c1=a[4]>a[2] and a[3]>a[2] and a[1]>a[2] and a>a[2] c2=a[4]<a[2] and a[3]<a[2] and a[1]<a[2] and a<a[2] //finding the double bottom if c1 then RefCloseDownNew=close[2] RefRSIDownNew=a[2] BarBullNew=barindex[2] endif if RefCloseDownNew<RefCloseDownOld and RefRSIDownNew>RefRSIDownOld then //double slash next line if you don't needed the mark on a different window bulldiv=1 //entry price for long on price window // double slash next line if not needed DRAWSEGMENT(BarBullNew, highest[(BarBullnew-BarBullOld)](close[1]), BarBullNew+10, highest[(BarBullnew-BarBullOld)](close[1])) //entry price for long on RSI window // double slash next line if not needed DRAWSEGMENT(BarBullNew, highest[(BarBullnew- BarBullOld)](a[1]), BarBullNew+10, highest[(BarBullnew-BarBullOld)](a[1])) else bulldiv=0 endif //Finding the double top if c2 then RefCloseUpNew=close[2] RefRSIUpNew=a[2] BarBearNew=barindex[2] endif if RefCloseUpNew>RefCloseUpOld and RefRSIUPNew<RefRSIUpOld then //double slash next line if you don't needed the mark on a different window beardiv=-1 //entry price for short on price window // double slash next line if not needed DRAWSEGMENT(BarBearNew, LOWEST[(BarBearnew-BarBearOld)](close[1]), BarBearNew+10, LOWEST[(BarBearnew-BarBearOld)](close[1])) //entry price for short on RSI window // double slash next line if not needed DRAWSEGMENT(BarBearNew, LOWEST[(BarBearnew-BarBearOld)](a[1]), BarBearNew+10, LOWEST[(BarBearnew-BarBearOld)](a[1])) else beardiv=0 endif //drawing RefCloseDownOld=RefCloseDownNew RefRSIDownOld=RefRSIDownNew RefCloseUpOld=RefCloseUpNew RefRSIUpOld=RefRSIUpNew BarBullOld=BarBullNew BarBearOld=BarBearNew return bulldiv, beardiv |
Share this
No information on this site is investment advice or a solicitation to buy or sell any financial instrument. Past performance is not indicative of future results. Trading may expose you to risk of loss greater than your deposits and is only suitable for experienced investors who have sufficient financial means to bear such risk.
ProRealTime ITF files and other attachments :
Find other exclusive trading pro-tools on ![]()
PRC is also on YouTube, subscribe to our channel for exclusive content and tutorials


Another clever, well coded and commented code! Well done gabri! This one will be a “best downloader” for sure 🙂
Thank you Nicolas, said by you it’s a big compliment!!
Great stuff, thank you
Gabri, when I add the indicator on the bottom of the chart I dont get an RSI style line like the one you show, but only a series of +1 or -1 signal, and when I add it in the price chart, the graph is shrinking.
What am I missing?
Apologies.
Francesco,
no apologies. The only thing I can think of is that the version of your PRT is different than mine. Send me a picture and I will try to figure it out. To avoid the 1 and -1 you have to dash out the lines 22,27,28, 39,44,45 and change line 56 with a simple return.
Thank you Gabri, will try and let you know
What you told me to do fixed the problem in the chart but I still dont see the indicator curve..
Francesco,
there is no curve for this indicator, only horizontal lines (segments) meant to be entry levels for the trades.
Ok, I understood. Thank you!
Hi Gabri, i’ve tried your code but it ‘s totally different from the one in your pictures.. it misses the horizontal lines on i am not allowed to attach file to show you..
Andy,
did you try to slash out the lines 22,27,28, 39,44,45 and change line 56 with a simple return?
wow what a speed reply.. i’ll try and let you know, thanks
before trying i noticed that it says there is error on line 24 and 26
Andy,
could it be that the PRT version you are using doesn’t support the function DRAWSEGMENT?
i dont know Gabri.. how can i check?
It should say your version when you start the program. Do you see any lines on the RSI graph?
no i dont see any lines..
I have a mac and my version is Java 1.0
I am not sure about the problem. If you have the 10.3 version of PRT you should be able to see it. Sorry!!
Ok, try this. On the price window (or on the RSI window) click on the wrench symbol, then choose “Add indicator” and click on the indicator “mio-divergenza-rsi”. Does it work like this?
i have only “Mio-rsi sui prezzi” as indicatore available, is it this one?
Andy, that was another code I made. You should either import the mio-divergenza-rsi.itf file that you find in the attachments or copy the code above and make a new indicator on your PRT (you can name it the way you want). After these steps are done click on the wrench symbol, then choose “Add indicator” and click on the indicator you just made (or imported)
wow.. probably i did something wrong.. let me try 😀
ok tried.. it says:
Errore nell’indicatore: Mio – divergenza RSIErrore di sintassi: Linea 22, carattere 12Uno dei seguenti caratteri sarebbe più appropriato di “(“:– “,”– “=”
In my code there is no character 12 on line 22!! can you tell me which is your line 22?
22 DRAWSEGMENT(BarBullNew, highest[(BarBullnew-BarBullOld)](close), BarBullNew+10, highest[(BarBullnew-BarBullOld)](close))//entry price for long on RSI window // double slash next line if not needed24 DRAWSEGMENT(BarBullNew, highest[(BarBullnew-BarBullOld)](a), BarBullNew+10, highest[(BarBullnew-BarBullOld)](a))
There is a warning signal on both..
Ok, I believe your version of PRT doesn’t support the command drawsegment. You should check with the helpdesk.
ok thanks!
Hello Gabri,
I looked at your divergence finder and it looks great. Is there a possible that you write some extra code so that the divergence is only found in oversold and overbought levels? That would be highly appreciated. Thanks in advance and with warmest regards,
Mert,
instead of the following line:
if RefCloseDownNewRefRSIDownOld then
just write
if RefCloseDownNewRefRSIDownOld and aRefCloseUpOld and RefRSIUPNewRefCloseUpOld and RefRSIUPNew70 then
it should help.
Great work, I like very much!
Can you encode this for other indicators that also provide strong divergence signals? Maybe MACD, stochastics, momentum.
I have in mind to create a divergence strategy, let’s say 5 divergences, and if 3 out of 5 agree the trade is started.
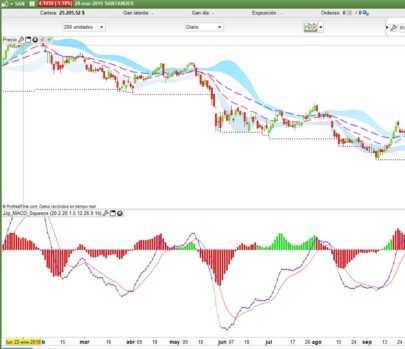
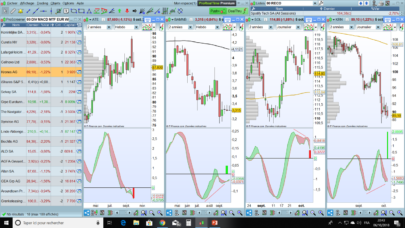
See Screenshort attached, the 1x you can see
Bearic divergences of CCI, MACD, RSI in the same candle
Bullish divergences of CCI, MACD, RSI in the same candle
Accordingly, the share price “follows” the divergences…
Can you program that?
Translated with http://www.DeepL.com/Translator
Thanks John. I guess you can change line 2 to use some other indicators. I use only RSI and RMI and so I tailored this code around it. to use MACD you can change line 2 to read a=MACDline[12,26,9](close) (or MACD[12,26,9](close)).
Only the indicators change in line 2? That’s all? I’ll try it!
I’ll answer when it’s done.
Thank´s so lot.
Thanks, Gabri.
Fantastic job ; hugely useful ;
Thanks Gabri 😉
Kris, you are always too nice!!
Based on this wonderful job I would like to propose this little change in the code that allows to make the divergent highs and lows more conspicuous on the RSI chart;
(sorry to post the code like this, but the insert does not seem to work here )
Best
//Variables
a=rsi[14](close)
once RefCloseDownOld=0
once RefRSIDownOld=0
once RefCloseUpOld=0
once RefRSIUpOld=0
once BarBullOld=0
once BarBearOld=0
//Conditions to identify max and min
c1=a[4]>a[2] and a[3]>a[2] and a[1]>a[2] and a>a[2] // bottom
c2=a[4]<a[2] and a[3]<a[2] and a[1]<a[2] and a<a[2] // top
//finding the double bottom
if c1 then
RefCloseDownNew=close[2]
RefRSIDownNew=a[2]
BarBullNew=barindex[2]
endif
if RefCloseDownNewRefRSIDownOld then
//double slash next line if you don’t needed the mark on a different window
bulldiv=a*0.9
//entry price for long on price window // double slash next line if not needed
//DRAWSEGMENT(BarBullOld, RefCloseDownOld – 2, BarBullNew, RefCloseDownNew – 2)coloured(255,0,0)
//entry price for long on RSI window // double slash next line if not needed
DRAWSEGMENT(BarBullOld, RefRSIDownOld – 2, BarBullNew, RefRSIDownNew – 2)coloured(255,0,0)
else
bulldiv=0
endif
//Finding the double top
if c2 then
RefCloseUpNew=close[2]
RefRSIUpNew=a[2]
BarBearNew=barindex[2]
endif
if RefCloseUpNew>RefCloseUpOld and RefRSIUPNew<RefRSIUpOld then
//double slash next line if you don't needed the mark on a different window
beardiv=a*0.9
//entry price for short on price window // double slash next line if not needed
//DRAWSEGMENT(BarBearOld, RefCloseUpOld – 2, BarBearNew, RefCloseUpNew – 2)coloured(255,0,0)
//entry price for short on RSI window // double slash next line if not needed
DRAWSEGMENT(BarBearOld, RefRSIUpOld + 2, BarBearNew, RefRSIUpNew + 2)coloured(255,0,0)
else
beardiv=0
endif
RefCloseDownOld=RefCloseDownNew
RefRSIDownOld=RefRSIDownNew
RefCloseUpOld=RefCloseUpNew
RefRSIUpOld=RefRSIUpNew
BarBullOld=BarBullNew
BarBearOld=BarBearNew
//grafica
return bulldiv coloured (0,255,0) style (histogram,1), beardiv coloured (255,0,0) style (histogram,1)
Bonjour à tous,
J’ai essayé de mettre de la couleur et les segments restent blanc.
Avez-vous une solution ?
D’avance merci.
Not working on V11. The RSI doesn’t appear on the chart.
Bonjour,
J’ai des soucis de lecture de syntaxe avec la variable “drawsegment” sur la version PRT 2021 gratuite. Et par ailleurs sur beaucoup d’autre code de divergence RSI, car beaucoup utilise cette variable. Je cherche un screener de divergences RSI et je n’ai pas le niveau pour régler ce probleme… Pourriez-vous m’aider, merci d’avance.
Salut Mika, j’ai la version V11.1, la formule fonctionne. Mais il est préférable, dixit Nicolas, d’importer la formule (mio-divergenza-rsi.itf) plutôt que de faire un copier coller