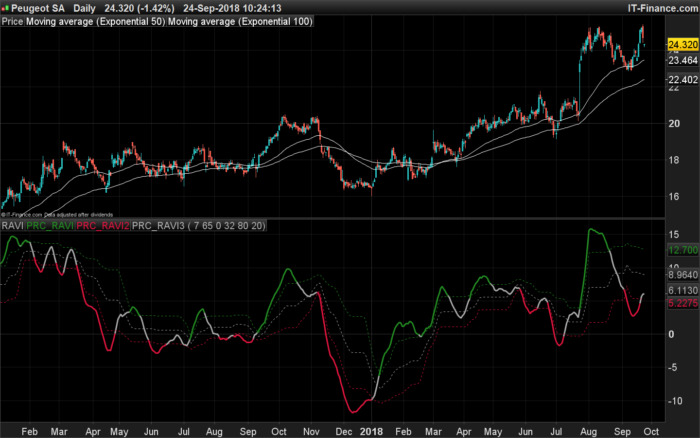
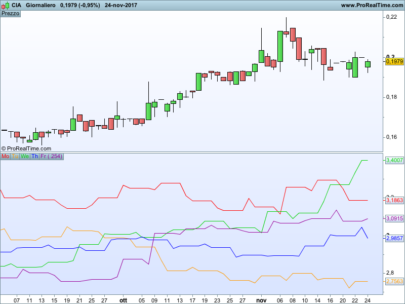
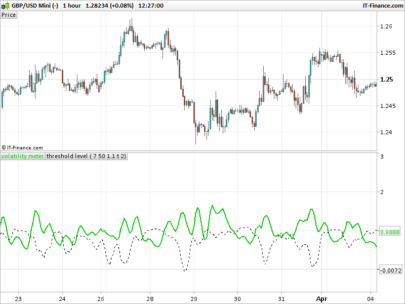
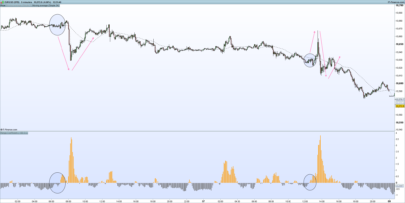
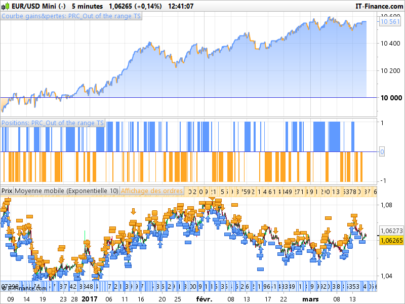
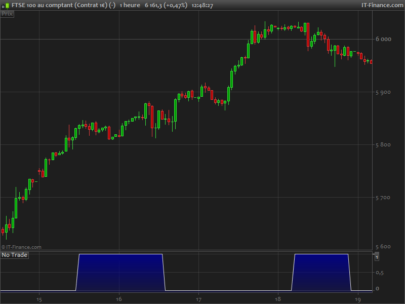
Developed by Tushar Chande, the Range Action Verification Index (RAVI) is used in order to help identify if the market is in a trend. The indicator shows the difference (in percentage) between the current prices and the past prices. Two key lines are recommended by Chande for the RAVI – 3% or 1% in dependence on the market.
A bull trend begins, when the RAVI crosses the 3% key line from bottom-up. The bull trend is considered as active as long as the indicator line moves up.
A bear trend begins, when the RAVI crosses the 1% key line from top to the downside. The bear trend is considered as active as long as the indicator line moves down.
This version embed the floating levels percentage to help determine short term reversal or earlier trend change signals. You can also modify the moving average type used in the oscillator calculation (default is Simple Moving Average).
|
1 2 3 4 5 6 7 8 9 10 11 12 13 14 15 16 17 18 19 20 21 22 23 24 25 26 27 28 29 30 31 32 33 34 35 36 37 38 39 40 41 42 |
//PRC_RAVI (Range Action Verification Index) | indicator //24.09.2018 //Nicolas @ www.prorealcode.com //Sharing ProRealTime knowledge //converted from MT5 version // --- settings FastPeriod = 7 // Fast period SlowPeriod = 65 // Slow period MAtype = 0 // Moving average type (1= exponential) inpFlPeriod = 32 // Floating levels period inpFlLevelUp = 80.0 // Up level % inpFlLevelDown = 20.0 // Down level % // --- end of settings inpPrice = customclose maFast = average[FastPeriod,MAtype](inpPrice) maSlow = average[SlowPeriod,MAtype](inpPrice) val = 100 * (maFast-maSlow)/maSlow imin = lowest[inpFlPeriod](val) imax = highest[inpFlPeriod](val) rrange = imax-imin flup = imin+inpFlLevelUp *rrange/100.0 fldn = imin+inpFlLevelDown*rrange/100.0 flmi = imin+50 *rrange/100.0 r=169 g=169 b=169 if val>flup then r=34 g=139 b=34 elsif val<fldn then r=220 g=20 b=60 endif return val coloured(r,g,b) style(line,3) as "RAVI", flup coloured(34,139,34) style(dottedline), fldn coloured(220,20,60) style(dottedline), flmi coloured(169,169,169) style(dottedline) |
Share this
No information on this site is investment advice or a solicitation to buy or sell any financial instrument. Past performance is not indicative of future results. Trading may expose you to risk of loss greater than your deposits and is only suitable for experienced investors who have sufficient financial means to bear such risk.
ProRealTime ITF files and other attachments :
Find other exclusive trading pro-tools on ![]()
PRC is also on YouTube, subscribe to our channel for exclusive content and tutorials


Hi Nicolas, great work! Is it possible to contact you to help with a couple of indicators? Thank you
Assistance is free on forums. For private job, you can contact me with the trading programming services form: https://www.prorealcode.com/trading-programming-services/
Thank you! I was reading the book Beyond Technical Analysis and wanted to try to coding RAVI myself, but the professionals have already done it. Much obliged to you 🙂