
1. Introduction
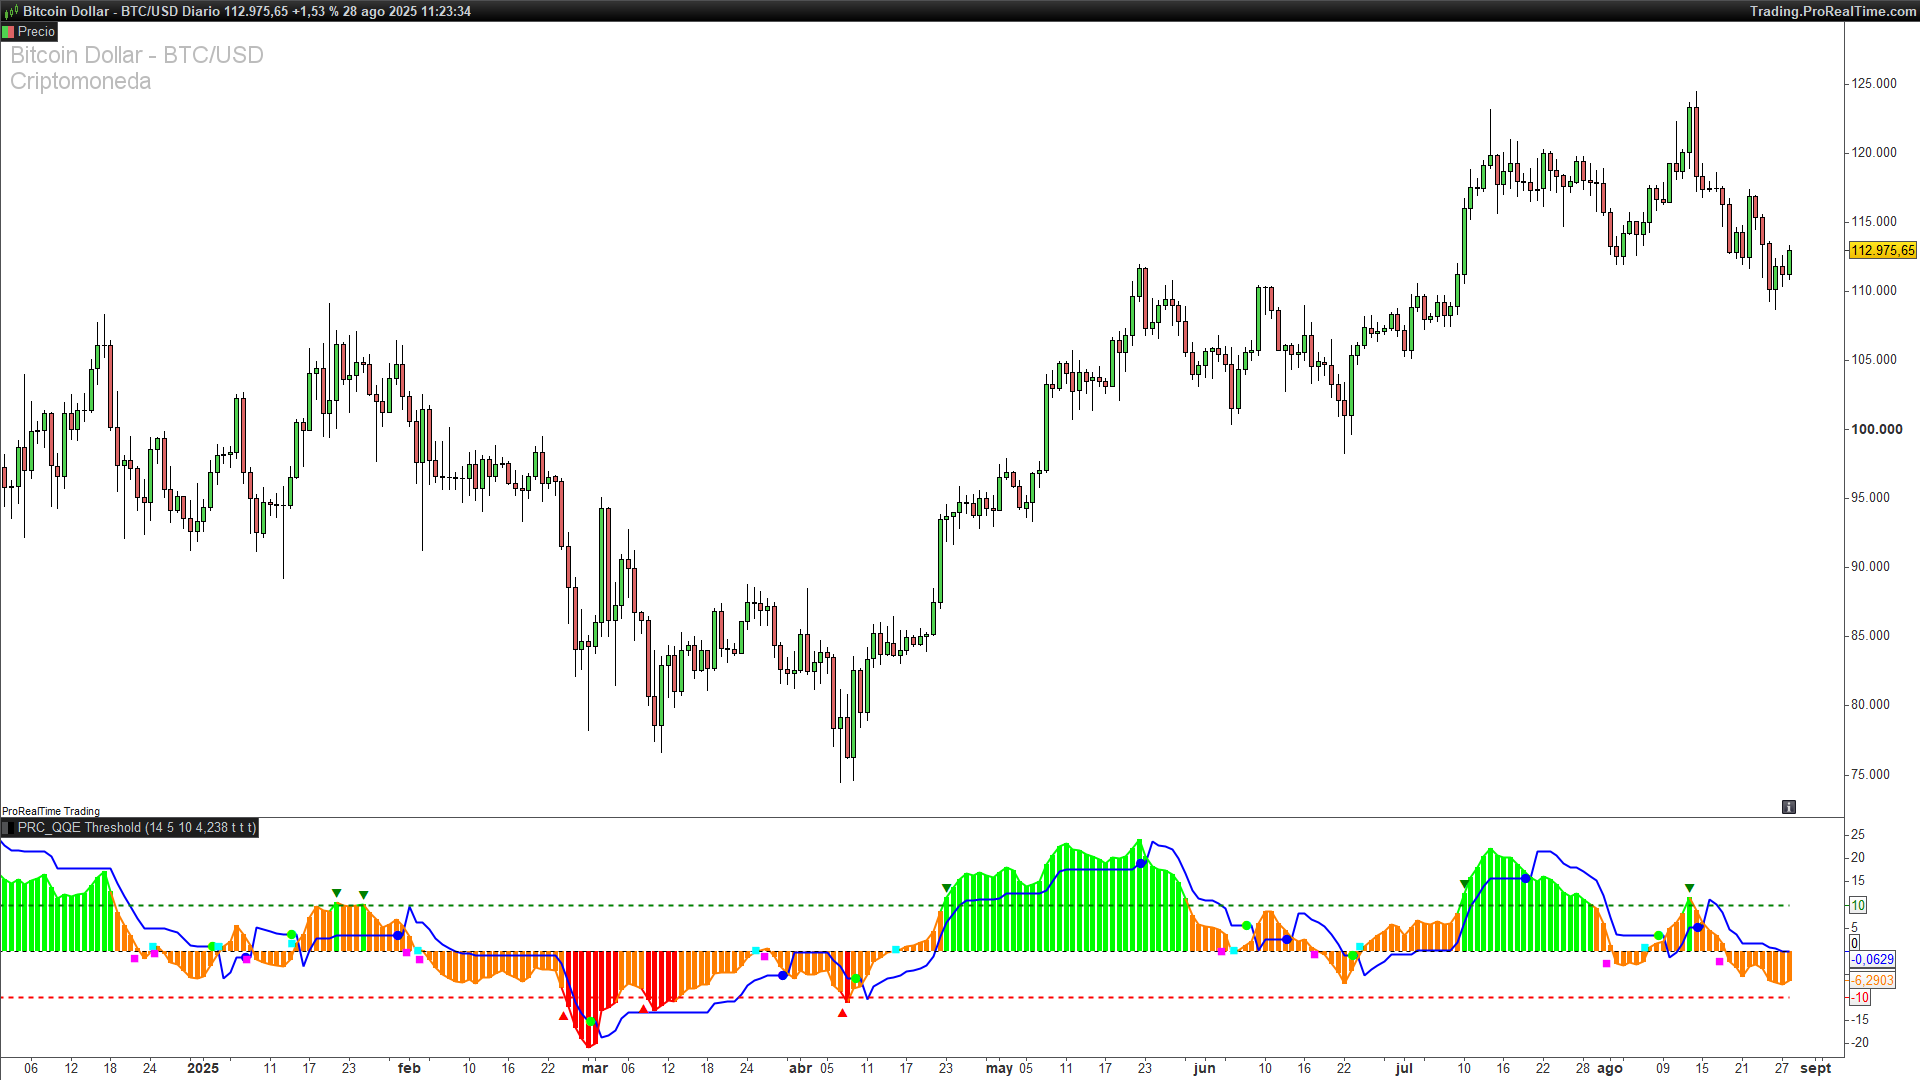
The QQE Threshold indicator is an advanced variation of the classic Quantitative Qualitative Estimation (QQE), developed by Glaz. This version adds intelligent threshold-based signal recognition to the traditional QQE model, giving traders enhanced insights into market momentum, reversals, and breakout strength.
This indicator is especially useful for traders seeking early and visually clear signals based on RSI dynamics, combined with adaptive volatility filters and a powerful color-coded visualization.
Note: This indicator builds upon the original QQE (Quantitative Qualitative Estimation) logic, which was also published on ProRealCode. If you’re unfamiliar with the core QQE concept, you can read the detailed breakdown here.
2. Indicator Fundamentals
The QQE Threshold is based on a smoothed Relative Strength Index (RSI) and integrates it with a volatility-based trailing line derived from Average True Range (ATR) of the RSI. Here’s how it works:
-
The base RSI is calculated and then smoothed using a simple moving average (
SF). -
From the smoothed RSI, a dynamic ATR of the RSI is computed and multiplied by a constant factor (
QQE) to determine the distance of the upper and lower bands. -
These bands evolve with price action and define a trailing stop-like structure for RSI values.
The innovation in this version lies in the use of threshold zones, visually displayed with user-defined upper and lower boundaries (default ±10), highlighting overbought and oversold pressure zones.
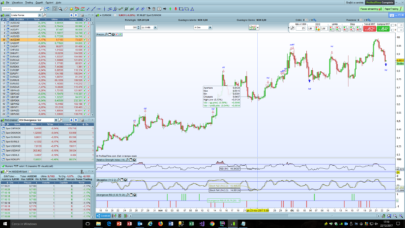
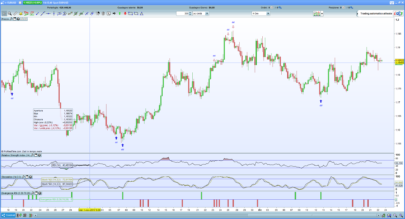
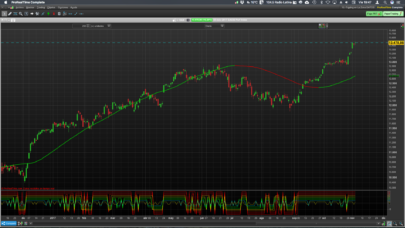
3. Signal Interpretation
The QQE Threshold indicator provides three core types of signals, which are customizable via toggles in the code:
-
Trend Signal Crosses (
showQQEx)
When the smoothed RSI crosses the dynamic band:-
Green dot (●) → Long signal (bullish shift)
-
Blue dot (●) → Short signal (bearish shift)
-
-
Zero Line Crosses (
showQQEz)
When the smoothed RSI crosses the 50 level:-
Aqua square (◼) → Upward momentum
-
Fuchsia square (◼) → Downward momentum
-
-
Threshold Channel Exits (
showQQEc)
When RSI exits the threshold zone:-
Green down triangle (▼) → RSI above +Threshold → Potential overbought
-
Red up triangle (▲) → RSI below -Threshold → Potential oversold
-
These signals help traders identify momentum shifts, trend reversals, and extreme sentiment zones with great clarity.
Additionally, a histogram colored based on the RSI position relative to the threshold adds quick visual feedback:
-
Green → Above threshold (bullish)
-
Red → Below threshold (bearish)
-
Orange → Neutral zone
4. Customizable Parameters
The indicator is flexible and includes several parameters for user customization:
-
RsiPeriod(default: 14): Period for the base RSI calculation. -
SF(default: 5): Smoothing factor for the RSI. -
QQE(default: 4.238): Multiplier applied to ATR of RSI to form the bands. -
Threshold(default: 10): Threshold zone for overbought/oversold levels. -
showQQEx,showQQEz,showQQEc: Toggles to show/hide specific signals.
Users can adapt these values depending on their trading strategy, asset volatility, or timeframe. For example:
-
A lower threshold (e.g., 5) makes the system more sensitive.
-
A higher smoothing factor slows down the reaction for trend-following strategies.
5. Practical Use Cases
This indicator can be applied in multiple trading styles:
-
Trend Confirmation: Confirm entries when RSI crosses the dynamic trailing band in the direction of the trend.
-
Reversal Detection: Use threshold zone exits as alerts for possible exhaustion and mean reversion.
-
Momentum Filtering: Combine with other indicators (e.g., moving averages) to confirm strength before acting.
-
Visual Clarity: The signal markers help discretionary traders spot important moments without second-guessing.
It’s ideal for swing trading, day trading, and momentum-based setups on any asset class.
6. Indicator Code in ProRealTime
|
1 2 3 4 5 6 7 8 9 10 11 12 13 14 15 16 17 18 19 20 21 22 23 24 25 26 27 28 29 30 31 32 33 34 35 36 37 38 39 40 41 42 43 44 45 46 47 48 49 50 51 52 53 54 55 56 57 58 59 60 61 62 63 64 65 66 67 68 69 70 71 72 73 74 75 76 77 78 79 80 81 82 83 84 85 86 87 88 89 90 91 92 93 94 95 96 97 98 99 100 101 102 103 104 105 106 107 108 109 110 111 112 113 114 115 116 117 118 119 120 121 122 123 124 125 126 127 |
//-----------------------------------------------------// //PRC_QQE Threshold by Glaz //version = 0 //27.06.24 //Iván González @ www.prorealcode.com //Sharing ProRealTime knowledge //-----------------------------------------------------// //-----Inputs------------------------------------------// src=close //Rsi Source RsiPeriod=14 //Rsi Length SF=5 //Rsi Smoothing QQE=4.238 //Fast QQE Factor ThreshHold=10 //Thresh-hold showQQEx=1 //Show Smooth Rsi and QQE Signal crosses showQQEz=1 //Show Smooth Rsi Zero crosses showQQEc=1 //Show Smooth Rsi Thresh Hold Channel Exits //-----------------------------------------------------// WildersPeriod=RsiPeriod*2-1 myrsi=rsi[RsiPeriod](src) RsiMa=average[SF,1](myrsi) AtrRsi=abs(RsiMa[1]-RsiMa) MaAtrRsi=average[WildersPeriod,1](AtrRsi) dar=average[WildersPeriod,1](MaAtrRsi)*QQE //-----------------------------------------------------// longband=0 shortband=0 trend=0 DeltaFastAtrRSI=dar RsIndex=RsiMa newShortBand=RsIndex+DeltaFastAtrRSI newLongBand=RsIndex-DeltaFastAtrRSI //-----------------------------------------------------// if RsIndex[1]>longband[1] and RsIndex>longband[1] then longband=max(longband[1],newlongband) else longband=newlongband endif //-----------------------------------------------------// if RsIndex[1]<shortband[1] and RsIndex<shortband[1] then shortband=min(shortband[1],newshortband) else shortband=newshortband endif //-----------------------------------------------------// if RsIndex crosses over shortband[1] then trend=1 elsif longband[1] crosses over RsIndex then trend=-1 else trend=trend[1] endif //-----------------------------------------------------// if trend=1 then FastAtrRsiTL=longband else FastAtrRsiTL=shortband endif //-----------------------------------------------------// if showQQEx and FastAtrRsiTL < RsIndex then QQExlong=QQExlong+1 if QQExlong=1 then drawtext("●︎",barindex[1],FastAtrRsiTL[1]-50)coloured("lime") endif else QQExlong=0 endif if showQQEx and FastAtrRsiTL > RsIndex then QQExshort=QQExshort+1 if QQExshort=1 then drawtext("●︎",barindex[1],FastAtrRsiTL[1]-50)coloured("blue") endif else QQExshort=0 endif //-----------------------------------------------------// if showQQEz and RsIndex>=50 then QQEzlong=QQEzlong+1 if QQEzlong=1 then drawtext("◼︎",barindex,RsiMa-50)coloured("aqua") endif else QQEzlong=0 endif if showQQEz and RsIndex<50 then QQEzshort=QQEzshort+1 if QQEzshort=1 then drawtext("◼︎︎",barindex,RsiMa-50)coloured("fuchsia") endif else QQEzshort=0 endif //-----------------------------------------------------// if showQQEc and RsIndex>(50+ThreshHold) then QQEclong=QQEclong+1 if QQEclong=1 then drawtext("▼",barindex,RsiMa-50+2)coloured("green") endif else QQEclong=0 endif if showQQEc and RsIndex<(50-ThreshHold) then QQEcshort=QQEcshort+1 if QQEcshort=1 then drawtext("▲︎",barindex,RsiMa-50-2)coloured("red") endif else QQEcshort=0 endif //-----------------------------------------------------// if RsiMa-50 > ThreshHold then r=0 g=255 b=0 elsif RsiMa-50<-ThreshHold then r=255 g=0 b=0 else r=255 g=127 b=0 endif //-----------------------------------------------------// //-----------------------------------------------------// return (RsiMa-50) coloured(r,g,b)style(histogram,1),(FastAtrRsiTL-50) coloured("blue")style(line,2), (RsiMa-50) coloured(r,g,b)style(line,2), ThreshHold style(dottedline,2)coloured("green"),-ThreshHold style(dottedline,2)coloured("red"),0 style(dottedline,1) |
Share this
No information on this site is investment advice or a solicitation to buy or sell any financial instrument. Past performance is not indicative of future results. Trading may expose you to risk of loss greater than your deposits and is only suitable for experienced investors who have sufficient financial means to bear such risk.
ProRealTime ITF files and other attachments :
Find other exclusive trading pro-tools on ![]()
PRC is also on YouTube, subscribe to our channel for exclusive content and tutorials


Hallo Iván
Ein sehr schöner guter Indikator, nach meinen ersten Tests ist er sehr Effektiv und in Verbindung mit anderen Indikatoren liefert er gute Trading Signale. Nun meine Frage, für die Trendsignalkreuzungen hast du mal ein Screener geplant oder das man ein Alarm setzen könnte ? Alarm und Screener wären Perfekt. Die anderen Signale sind nicht ganz so wichtig , dienen nur zur schnelleren Information. Ich hoffe du kannst uns da was erstellen. Danke im Voraus
Gruß Chrisinobi
Danke, ich werde es berücksichtigen.
Hallo Ivan, das ich das noch erleben darf….QQE in dieser Qualität bei ProRealTime…vielen Dank, hast du super hinbekommen, habe ich sofort integriert….Gruß Holger
Ich freue mich sehr!