

Pure Price Action Liquidity Sweeps
Summary
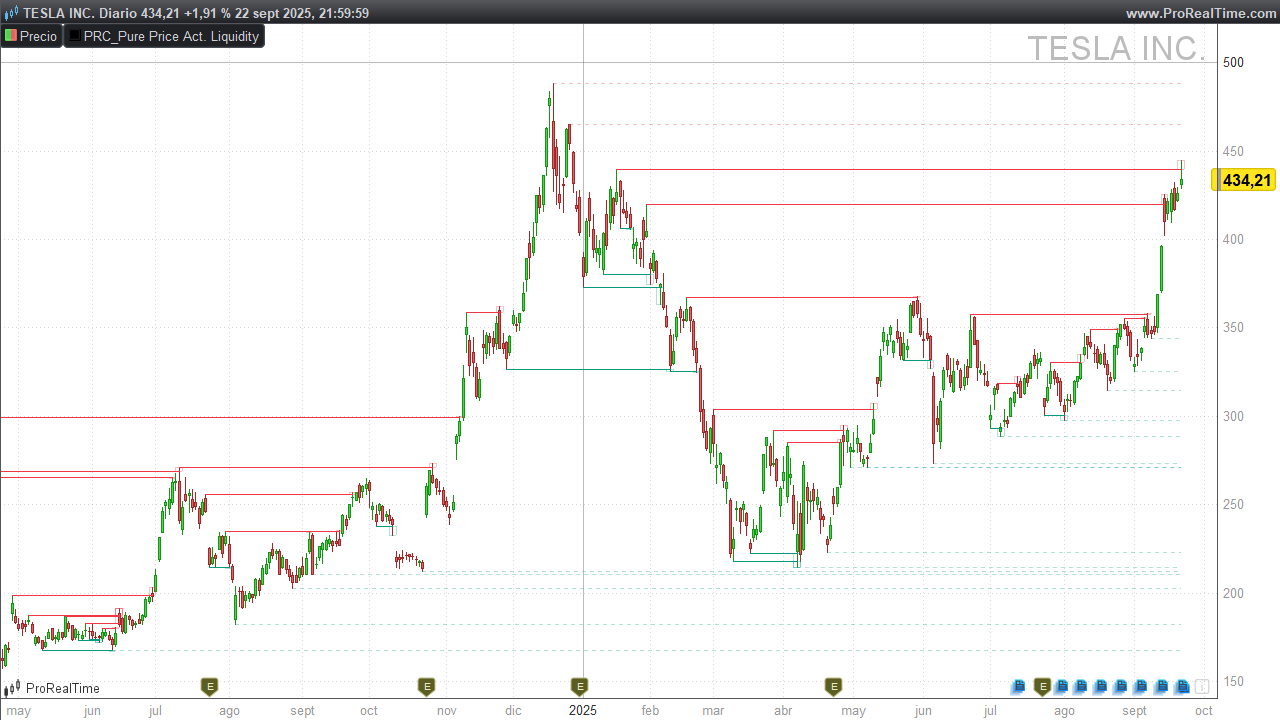
Pure Price Action Liquidity Sweeps (by LuxAlgo) detects bullish and bearish liquidity sweeps around recent pivot highs/lows. It plots horizontal liquidity lines from the pivot and highlights sweep zones when price wicks through a level and closes back inside. Untouched (unswept) levels remain as dotted lines; swept levels are drawn solid with a small rectangle marking the sweep.
1) Liquidity Sweeps
-
Liquidity pools often sit above swing highs (buy-stop clusters) and below swing lows (sell-stop clusters).
-
A breakout is price closing beyond a level with follow-through.
-
A liquidity sweep (a.k.a. stop run) is price wicking through a prior high/low to trigger stops, then closing back inside the prior range.
-
After a sweep, markets often revert toward the prior range or pivot area; however, strong trends can ignore this and keep pushing.
2) How the Indicator Works
Pivot detection by depth
You control the sensitivity with profundidad:
-
Short-Term (1):
periodoPivote = 5,offset = 2 -
Mid-Term (2):
periodoPivote = 13,offset = 6 -
Long-Term (3):
periodoPivote = 21,offset = 10
A Pivot High is confirmed when high[offset] equals the highest high over periodoPivote.
A Pivot Low is confirmed when low[offset] equals the lowest low over periodoPivote.
Note: Pivots confirm with a delay (
offset) by design—this reduces noise.
Sweep vs mitigation logic
For each active pivot level (within limiteBarras):
-
Bearish sweep (above a Pivot High):
If price wicks above the pivot high but the close is back below it → mark as swept and draw a small rectangle around the sweep candle’s wick (frompivottomax wick). -
Bullish sweep (below a Pivot Low):
If price wicks below the pivot low but the close is back above it → mark as swept and draw a small rectangle (frommin wicktopivot). -
Mitigation (level invalidation):
If a close beyond the level occurs (close above a high-pivot line for bearish side, or close below a low-pivot line for bullish side), the level is considered mitigated and stops plotting.
Drawing rules
-
Unswept & unmitigated: draw dotted horizontal line from the pivot bar to the current bar.
-
Swept: draw solid line from the pivot bar to the sweep bar, plus a semi-transparent rectangle marking the sweep.
-
Visibility & performance: at most
maxLineaslines per side are drawn; only pivots within the lastlimiteBarrasbars are considered. Processing happens at bar close.
3) Reading the Signals on Chart
-
Bearish liquidity sweep (above highs)
You’ll see a solid red line from the pivot high to the sweep bar and a small red rectangle above the line. This suggests a failed breakout/stop run and potential mean reversion or downside reaction. -
Bullish liquidity sweep (below lows)
You’ll see a solid green line from the pivot low to the sweep bar and a green rectangle below the line. This hints at a failed breakdown and potential upside reaction. -
When to be cautious
-
Strong trends can convert sweeps into continuation (sweep + immediate close through the level on subsequent bars).
-
Dense clusters of equal highs/lows can create multiple sweeps—use context and risk controls.
-
4) Inputs & Defaults (Configuration Guide)
| Input | Default | What it does | Impact |
|---|---|---|---|
profundidad |
1 |
1 = Short-Term, 2 = Mid-Term, 3 = Long-Term | Higher values = fewer, stronger pivots (less noise). |
maxLineas |
40 |
Max liquidity lines per side to display | Prevents clutter; lower for scalping. |
limiteBarras |
2000 |
Lifetime of a pivot level (bars) | Limits historical processing & drawing. |
RedAlcista GreenAlcista BlueAlcista |
8, 153, 129 |
RGB for bullish lines | Visual theme for bullish sweeps. |
AlphaAlcista |
255 |
Opacity for bullish solid lines | Full opacity on swept lines. |
AlphaBarridoAlcista |
80 |
Opacity for bullish fill | Semi-transparent sweep rectangle. |
RedBajista GreenBajista BlueBajista |
242, 54, 69 |
RGB for bearish lines | Visual theme for bearish sweeps. |
AlphaBajista |
255 |
Opacity for bearish solid lines | Full opacity on swept lines. |
AlphaBarridoBajista |
80 |
Opacity for bearish fill | Semi-transparent sweep rectangle. |
Depth mapping (for quick tuning):
-
profundidad = 1→periodoPivote = 5,offset = 2(fast/short-term) -
profundidad = 2→periodoPivote = 13,offset = 6(balanced/mid-term) -
profundidad = 3→periodoPivote = 21,offset = 10(slow/long-term)
5) ProBuilder Code (Paste & Go)
//---------------------------------------------------//
//PRC_Pure Price Action Liquidity Sweeps (by LuxAlgo)
//version = 0
//23.09.25
//Iván González @ www.prorealcode.com
//---------------------------------------------------//
// --- Configuración (Variables personalizables) --- //
//---------------------------------------------------//
// Detección: 1 = Corto Plazo, 2 = Plazo Intermedio, 3 = Largo Plazo
profundidad = 1
// Límite de líneas de liquidez (máximos y mínimos) a mostrar en el gráfico
maxLineas = 40
// Límite de barras para mantener un nivel de pivote activo en el gráfico
limiteBarras = 2000
// Colores (formato RGB: Rojo, Verde, Azul, Opacidad)
RedAlcista = 8
GreenAlcista = 153
BlueAlcista = 129
AlphaAlcista = 255
AlphaBarridoAlcista = 80
RedBajista = 242
GreenBajista = 54
BlueBajista = 69
AlphaBajista = 255
AlphaBarridoBajista = 80
//---------------------------------------------------//
// -------------- Lógica de Pivotes ---------------- //
//---------------------------------------------------//

IF profundidad = 1 THEN // (Short Term)
   periodoPivote = 5
   offset = 2
ELSIF profundidad = 2 THEN // (Mid Term)
   periodoPivote = 13
   offset = 6
ELSE // profundidad = 3 (Long Term)
   periodoPivote = 21
   offset = 10
ENDIF
//---------------------------------------------------//
// ----- Inicialización y Detección de Pivotes ----- //
//---------------------------------------------------//

ONCE pivHCount = 0
ONCE pivLCount = 0

ph = 0
pl = 0

// Detectar pivote de máximo (Pivot High)
IF high[offset] = HIGHEST[periodoPivote](high) THEN
   ph = high[offset]
ENDIF

// Detectar pivote de mínimo (Pivot Low)
IF low[offset] = LOWEST[periodoPivote](low) THEN
   pl = low[offset]
ENDIF

// Almacenar nuevo pivote de máximo
IF ph > 0 AND (pivHCount = 0 OR ph <> $pivHPrc[max(0,pivHCount - 1)]) THEN
   $pivHPrc[pivHCount] = ph
   $pivHBix[pivHCount] = barindex - offset
   pivHCount = pivHCount + 1
ENDIF

// Almacenar nuevo pivote de mínimo
IF pl > 0 AND (pivLCount = 0 OR pl <> $pivLPrc[max(0,pivLCount - 1)]) THEN
   $pivLPrc[pivLCount] = pl
   $pivLBix[pivLCount] = barindex - offset
   pivLCount = pivLCount + 1
ENDIF

//---------------------------------------------------//
// ------- Lógica de Procesamiento y Dibujo -------- //
//---------------------------------------------------//

IF ISLASTBARUPDATE THEN
   // --- PROCESAMIENTO DE PIVOTES DE MÁXIMOS (BARRIDOS BAJISTAS)
   lineasDibujadasH = 0
   FOR i = pivHCount - 1 DOWNTO 0
      IF lineasDibujadasH >= maxLineas THEN
         BREAK
      ENDIF
      IF barindex - $pivHBix[i] < limiteBarras THEN
         esMitigado = 0
         esBarrido = 0
         indiceBarrido = -1
         maximoBarrido = 0
         FOR j = $pivHBix[i] + 1 TO barindex
            IF close[barindex-j] > $pivHPrc[i] THEN
               esMitigado = 1
               BREAK
            ENDIF
            IF high[barindex-j] > $pivHPrc[i] AND close[barindex-j] < $pivHPrc[i] THEN
               esBarrido = 1
               indiceBarrido = j
               maximoBarrido = high[barindex-j]
               BREAK
            ENDIF
         NEXT
         IF esMitigado = 0 THEN
            lineasDibujadasH = lineasDibujadasH + 1
            IF esBarrido THEN
               DRAWSEGMENT($pivHBix[i], $pivHPrc[i], indiceBarrido, $pivHPrc[i]) STYLE(Line, 1) COLOURED(RedBajista,GreenBajista,BlueBajista,AlphaBajista)
               DRAWRECTANGLE(indiceBarrido - 1, maximoBarrido, indiceBarrido + 1, $pivHPrc[i]) COLOURED(RedBajista,GreenBajista,BlueBajista,AlphaBarridoBajista)
            ELSE
               DRAWSEGMENT($pivHBix[i], $pivHPrc[i], barindex, $pivHPrc[i]) STYLE(dottedLine, 1) COLOURED(RedBajista,GreenBajista,BlueBajista,AlphaBarridoBajista)
            ENDIF
         ENDIF
      ENDIF
   NEXT

   // --- PROCESAMIENTO DE PIVOTES DE MÍNIMOS (BARRIDOS ALCISTAS)
   lineasDibujadasL = 0
   FOR i = pivLCount - 1 DOWNTO 0
      IF lineasDibujadasL >= maxLineas THEN
         BREAK
      ENDIF
      IF barindex - $pivLBix[i] < limiteBarras THEN
         esMitigado = 0
         esBarrido = 0
         indiceBarrido = -1
         minimoBarrido = 0
         FOR j = $pivLBix[i] + 1 TO barindex
            IF close[barindex-j] < $pivLPrc[i] THEN
               esMitigado = 1
               BREAK
            ENDIF
            IF low[barindex-j] < $pivLPrc[i] AND close[barindex-j] > $pivLPrc[i] THEN
               esBarrido = 1
               indiceBarrido = j
               minimoBarrido = low[barindex-j]
               BREAK
            ENDIF
         NEXT
         IF esMitigado = 0 THEN
            lineasDibujadasL = lineasDibujadasL + 1
            IF esBarrido THEN
               DRAWSEGMENT($pivLBix[i], $pivLPrc[i], indiceBarrido, $pivLPrc[i]) STYLE(Line, 1) COLOURED(RedAlcista,GreenAlcista,BlueAlcista,AlphaAlcista)
               DRAWRECTANGLE(indiceBarrido - 1, $pivLPrc[i], indiceBarrido + 1, minimoBarrido) COLOURED(RedAlcista,GreenAlcista,BlueAlcista,AlphaBarridoAlcista)
            ELSE
               DRAWSEGMENT($pivLBix[i], $pivLPrc[i], barindex, $pivLPrc[i]) STYLE(dottedLine, 1) COLOURED(RedAlcista,GreenAlcista,BlueAlcista,AlphaBarridoAlcista)
            ENDIF
         ENDIF
      ENDIF
   NEXT
ENDIF
//---------------------------------------------------//
RETURN
