Summary
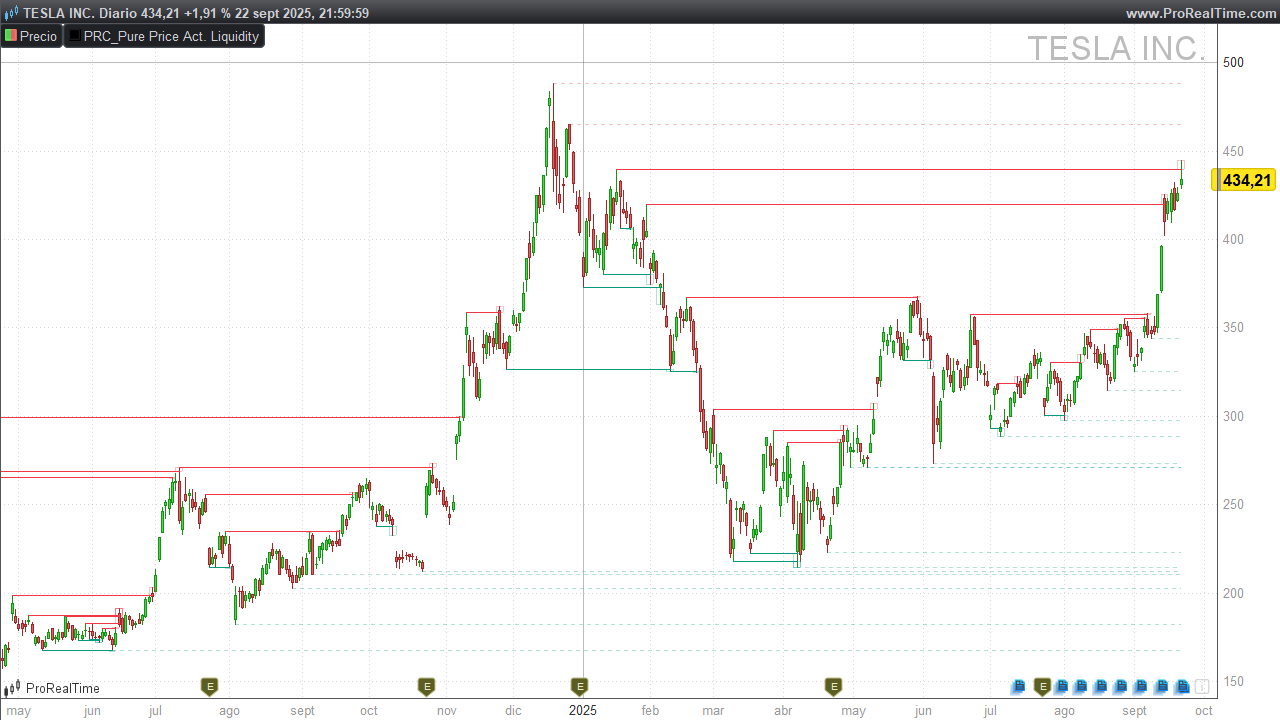
Pure Price Action Liquidity Sweeps (by LuxAlgo) detects bullish and bearish liquidity sweeps around recent pivot highs/lows. It plots horizontal liquidity lines from the pivot and highlights sweep zones when price wicks through a level and closes back inside. Untouched (unswept) levels remain as dotted lines; swept levels are drawn solid with a small rectangle marking the sweep.
1) Liquidity Sweeps
-
Liquidity pools often sit above swing highs (buy-stop clusters) and below swing lows (sell-stop clusters).
-
A breakout is price closing beyond a level with follow-through.
-
A liquidity sweep (a.k.a. stop run) is price wicking through a prior high/low to trigger stops, then closing back inside the prior range.
-
After a sweep, markets often revert toward the prior range or pivot area; however, strong trends can ignore this and keep pushing.
2) How the Indicator Works
Pivot detection by depth
You control the sensitivity with profundidad:
-
Short-Term (1):
periodoPivote = 5,offset = 2 -
Mid-Term (2):
periodoPivote = 13,offset = 6 -
Long-Term (3):
periodoPivote = 21,offset = 10
A Pivot High is confirmed when high[offset] equals the highest high over periodoPivote.
A Pivot Low is confirmed when low[offset] equals the lowest low over periodoPivote.
Note: Pivots confirm with a delay (
offset) by design—this reduces noise.
Sweep vs mitigation logic
For each active pivot level (within limiteBarras):
-
Bearish sweep (above a Pivot High):
If price wicks above the pivot high but the close is back below it → mark as swept and draw a small rectangle around the sweep candle’s wick (frompivottomax wick). -
Bullish sweep (below a Pivot Low):
If price wicks below the pivot low but the close is back above it → mark as swept and draw a small rectangle (frommin wicktopivot). -
Mitigation (level invalidation):
If a close beyond the level occurs (close above a high-pivot line for bearish side, or close below a low-pivot line for bullish side), the level is considered mitigated and stops plotting.
Drawing rules
-
Unswept & unmitigated: draw dotted horizontal line from the pivot bar to the current bar.
-
Swept: draw solid line from the pivot bar to the sweep bar, plus a semi-transparent rectangle marking the sweep.
-
Visibility & performance: at most
maxLineaslines per side are drawn; only pivots within the lastlimiteBarrasbars are considered. Processing happens at bar close.
3) Reading the Signals on Chart
-
Bearish liquidity sweep (above highs)
You’ll see a solid red line from the pivot high to the sweep bar and a small red rectangle above the line. This suggests a failed breakout/stop run and potential mean reversion or downside reaction. -
Bullish liquidity sweep (below lows)
You’ll see a solid green line from the pivot low to the sweep bar and a green rectangle below the line. This hints at a failed breakdown and potential upside reaction. -
When to be cautious
-
Strong trends can convert sweeps into continuation (sweep + immediate close through the level on subsequent bars).
-
Dense clusters of equal highs/lows can create multiple sweeps—use context and risk controls.
-
4) Inputs & Defaults (Configuration Guide)
| Input | Default | What it does | Impact |
|---|---|---|---|
profundidad |
1 |
1 = Short-Term, 2 = Mid-Term, 3 = Long-Term | Higher values = fewer, stronger pivots (less noise). |
maxLineas |
40 |
Max liquidity lines per side to display | Prevents clutter; lower for scalping. |
limiteBarras |
2000 |
Lifetime of a pivot level (bars) | Limits historical processing & drawing. |
RedAlcista GreenAlcista BlueAlcista |
8, 153, 129 |
RGB for bullish lines | Visual theme for bullish sweeps. |
AlphaAlcista |
255 |
Opacity for bullish solid lines | Full opacity on swept lines. |
AlphaBarridoAlcista |
80 |
Opacity for bullish fill | Semi-transparent sweep rectangle. |
RedBajista GreenBajista BlueBajista |
242, 54, 69 |
RGB for bearish lines | Visual theme for bearish sweeps. |
AlphaBajista |
255 |
Opacity for bearish solid lines | Full opacity on swept lines. |
AlphaBarridoBajista |
80 |
Opacity for bearish fill | Semi-transparent sweep rectangle. |
Depth mapping (for quick tuning):
-
profundidad = 1→periodoPivote = 5,offset = 2(fast/short-term) -
profundidad = 2→periodoPivote = 13,offset = 6(balanced/mid-term) -
profundidad = 3→periodoPivote = 21,offset = 10(slow/long-term)
5) ProBuilder Code (Paste & Go)
|
1 2 3 4 5 6 7 8 9 10 11 12 13 14 15 16 17 18 19 20 21 22 23 24 25 26 27 28 29 30 31 32 33 34 35 36 37 38 39 40 41 42 43 44 45 46 47 48 49 50 51 52 53 54 55 56 57 58 59 60 61 62 63 64 65 66 67 68 69 70 71 72 73 74 75 76 77 78 79 80 81 82 83 84 85 86 87 88 89 90 91 92 93 94 95 96 97 98 99 100 101 102 103 104 105 106 107 108 109 110 111 112 113 114 115 116 117 118 119 120 121 122 123 124 125 126 127 128 129 130 131 132 133 134 135 136 137 138 139 140 141 142 143 144 145 146 147 148 149 150 |
//---------------------------------------------------// //PRC_Pure Price Action Liquidity Sweeps (by LuxAlgo) //version = 0 //23.09.25 //Iván González @ www.prorealcode.com //---------------------------------------------------// // --- Configuración (Variables personalizables) --- // //---------------------------------------------------// // Detección: 1 = Corto Plazo, 2 = Plazo Intermedio, 3 = Largo Plazo profundidad = 1 // Límite de líneas de liquidez (máximos y mínimos) a mostrar en el gráfico maxLineas = 40 // Límite de barras para mantener un nivel de pivote activo en el gráfico limiteBarras = 2000 // Colores (formato RGB: Rojo, Verde, Azul, Opacidad) RedAlcista = 8 GreenAlcista = 153 BlueAlcista = 129 AlphaAlcista = 255 AlphaBarridoAlcista = 80 RedBajista = 242 GreenBajista = 54 BlueBajista = 69 AlphaBajista = 255 AlphaBarridoBajista = 80 //---------------------------------------------------// // -------------- Lógica de Pivotes ---------------- // //---------------------------------------------------// IF profundidad = 1 THEN // (Short Term) periodoPivote = 5 offset = 2 ELSIF profundidad = 2 THEN // (Mid Term) periodoPivote = 13 offset = 6 ELSE // profundidad = 3 (Long Term) periodoPivote = 21 offset = 10 ENDIF //---------------------------------------------------// // ----- Inicialización y Detección de Pivotes ----- // //---------------------------------------------------// ONCE pivHCount = 0 ONCE pivLCount = 0 ph = 0 pl = 0 // Detectar pivote de máximo (Pivot High) IF high[offset] = HIGHEST[periodoPivote](high) THEN ph = high[offset] ENDIF // Detectar pivote de mínimo (Pivot Low) IF low[offset] = LOWEST[periodoPivote](low) THEN pl = low[offset] ENDIF // Almacenar nuevo pivote de máximo IF ph > 0 AND (pivHCount = 0 OR ph <> $pivHPrc[max(0,pivHCount - 1)]) THEN $pivHPrc[pivHCount] = ph $pivHBix[pivHCount] = barindex - offset pivHCount = pivHCount + 1 ENDIF // Almacenar nuevo pivote de mínimo IF pl > 0 AND (pivLCount = 0 OR pl <> $pivLPrc[max(0,pivLCount - 1)]) THEN $pivLPrc[pivLCount] = pl $pivLBix[pivLCount] = barindex - offset pivLCount = pivLCount + 1 ENDIF //---------------------------------------------------// // ------- Lógica de Procesamiento y Dibujo -------- // //---------------------------------------------------// IF ISLASTBARUPDATE THEN // --- PROCESAMIENTO DE PIVOTES DE MÁXIMOS (BARRIDOS BAJISTAS) lineasDibujadasH = 0 FOR i = pivHCount - 1 DOWNTO 0 IF lineasDibujadasH >= maxLineas THEN BREAK ENDIF IF barindex - $pivHBix[i] < limiteBarras THEN esMitigado = 0 esBarrido = 0 indiceBarrido = -1 maximoBarrido = 0 FOR j = $pivHBix[i] + 1 TO barindex IF close[barindex-j] > $pivHPrc[i] THEN esMitigado = 1 BREAK ENDIF IF high[barindex-j] > $pivHPrc[i] AND close[barindex-j] < $pivHPrc[i] THEN esBarrido = 1 indiceBarrido = j maximoBarrido = high[barindex-j] BREAK ENDIF NEXT IF esMitigado = 0 THEN lineasDibujadasH = lineasDibujadasH + 1 IF esBarrido THEN DRAWSEGMENT($pivHBix[i], $pivHPrc[i], indiceBarrido, $pivHPrc[i]) STYLE(Line, 1) COLOURED(RedBajista,GreenBajista,BlueBajista,AlphaBajista) DRAWRECTANGLE(indiceBarrido - 1, maximoBarrido, indiceBarrido + 1, $pivHPrc[i]) COLOURED(RedBajista,GreenBajista,BlueBajista,AlphaBarridoBajista) ELSE DRAWSEGMENT($pivHBix[i], $pivHPrc[i], barindex, $pivHPrc[i]) STYLE(dottedLine, 1) COLOURED(RedBajista,GreenBajista,BlueBajista,AlphaBarridoBajista) ENDIF ENDIF ENDIF NEXT // --- PROCESAMIENTO DE PIVOTES DE MÍNIMOS (BARRIDOS ALCISTAS) lineasDibujadasL = 0 FOR i = pivLCount - 1 DOWNTO 0 IF lineasDibujadasL >= maxLineas THEN BREAK ENDIF IF barindex - $pivLBix[i] < limiteBarras THEN esMitigado = 0 esBarrido = 0 indiceBarrido = -1 minimoBarrido = 0 FOR j = $pivLBix[i] + 1 TO barindex IF close[barindex-j] < $pivLPrc[i] THEN esMitigado = 1 BREAK ENDIF IF low[barindex-j] < $pivLPrc[i] AND close[barindex-j] > $pivLPrc[i] THEN esBarrido = 1 indiceBarrido = j minimoBarrido = low[barindex-j] BREAK ENDIF NEXT IF esMitigado = 0 THEN lineasDibujadasL = lineasDibujadasL + 1 IF esBarrido THEN DRAWSEGMENT($pivLBix[i], $pivLPrc[i], indiceBarrido, $pivLPrc[i]) STYLE(Line, 1) COLOURED(RedAlcista,GreenAlcista,BlueAlcista,AlphaAlcista) DRAWRECTANGLE(indiceBarrido - 1, $pivLPrc[i], indiceBarrido + 1, minimoBarrido) COLOURED(RedAlcista,GreenAlcista,BlueAlcista,AlphaBarridoAlcista) ELSE DRAWSEGMENT($pivLBix[i], $pivLPrc[i], barindex, $pivLPrc[i]) STYLE(dottedLine, 1) COLOURED(RedAlcista,GreenAlcista,BlueAlcista,AlphaBarridoAlcista) ENDIF ENDIF ENDIF NEXT ENDIF //---------------------------------------------------// RETURN |
Share this
No information on this site is investment advice or a solicitation to buy or sell any financial instrument. Past performance is not indicative of future results. Trading may expose you to risk of loss greater than your deposits and is only suitable for experienced investors who have sufficient financial means to bear such risk.
ProRealTime ITF files and other attachments :PRC is also on YouTube, subscribe to our channel for exclusive content and tutorials



Nel caricarlo mi da errore “formato incorretto” , puoi controllare?
Grazie
Provi a copiare e incollare il codice qui sopra. Che errore le dà?
Esattamente quanto scritto sopra
Ho provato a copiare ed incollare e funziona.
Grazie