Open Range Breakout Indicator ORB

Open Range Breakout Indicator ORB

Hello everyone,
Here is the ORB indicator (Open Range Breakout) used in the famous strategy of Toby Crabel:
http://www.amazon.fr/Trading-Short-Patterns-Opening-Breakout/dp/0934380171

An explanation video:

https://www.youtube.com/watch?v=CAHG_KAhhJw

Some other details here:

https://www.wpi.edu/Pubs/E-project/Available/E-project-042910-142422/unrestricted/Veselin_Iliev_IQP.pdf

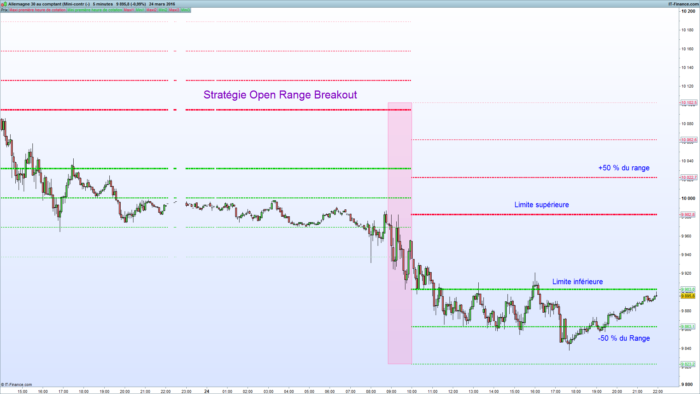
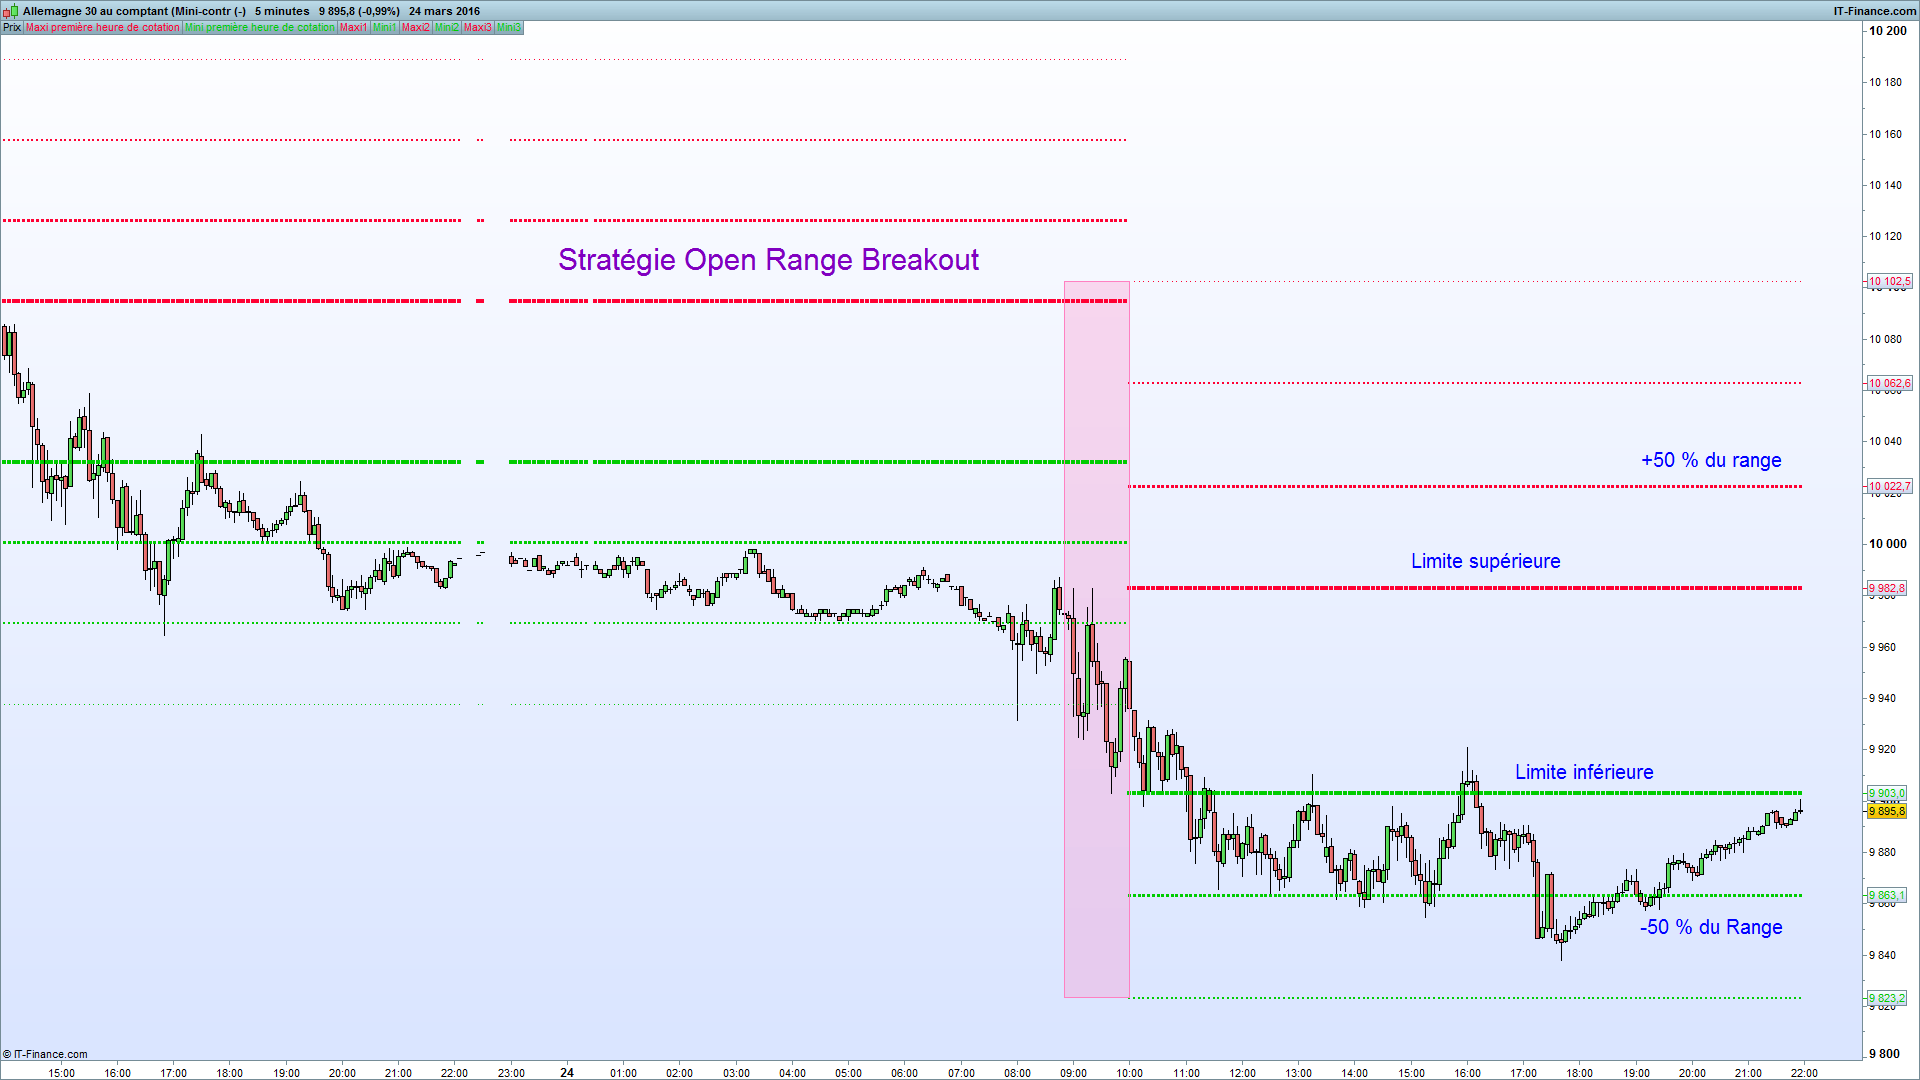
This indicator shows the highest and lowest in the first hour of trading that is very important. Default 9:00AM / 10.00AM. (European time zone)
This defines a Support and Resistance which we monitor breakage / Breakout in this strategy.

Bearings of 50% of the obtained range are also plotted.

It is of course quite possible, if desired, to change the indicator parameter for other time range

Bons trades 🙂

Zilliq


____________________________________

Coding is not a crime 😉

http://www.zilliqtradingresearch.fr/


Share this

Risk disclosure:

No information on this site is investment advice or a solicitation to buy or sell any financial instrument. Past performance is not indicative of future results. Trading may expose you to risk of loss greater than your deposits and is only suitable for experienced investors who have sufficient financial means to bear such risk.

ProRealTime ITF files and other attachments : How to import ITF files into ProRealTime platform?

PRC is also on YouTube, subscribe to our channel for exclusive content and tutorials

  1. flowsen123 • 03/25/2016 #

    Hey zilliq,
    thank you for the code. But if I try to import it, it opens as an extra window, right below the normal chart.
    how can I get it in the chart?
     
    Cheers
    Flo

  2. flowsen123 • 03/25/2016 #

    sorry for asking… I found the problem.

  3. prorealcode48 • 03/25/2016 #

    bonjour,
    Après import, “
    Open Range Breakout Indicator ORB” n’apparaît dans la liste des Proscreener. Pourquoi ?

    • Nicolas • 03/25/2016 #

      Bonjour, parce qu’il s’agit d’un indicateur et non d’un screener 🙂

  4. Dunger • 03/25/2016 #

    Hi,
    Nice indicator.
    How do you display just the one set of lines for a given day, rather than all previous lines please?
    Regards.
     

  5. Daniel da Costa • 03/25/2016 #

    Hi zilliq! I have imported the indicator into Prorealtime but it doesn’t overlay the price chart , it has a seperated like the other indicators eg MACD, am i doing something wrong?

  6. Tom C • 03/25/2016 #

     how do you overlay in price chart?

    • Nicolas • 03/25/2016 #

      Use the wrench of the price chart.

  7. ken kiplimo • 03/25/2016 #

    I really need this ORB indicator in mq4 or EXE file. Who has it Please?

    • Nicolas • 03/25/2016 #

      This website is dedicated to prorealtime programming, you’ll not find any MT4 files around here.

    • ken kiplimo • 03/25/2016 #

      Thanks Nicolas.

  8. ken kiplimo • 03/25/2016 #

    Thanks Nico for the advice. I was talking about this file “open-range-breakout-orb.itf” and if it can be saved in exe format

  9. Bel • 03/25/2016 #

    good day traders. i tried to download this ORB indi but when i load using wrench it just plots black lines, nothing like the chart here. any suggestion guys? thanks

  10. eisi • 03/25/2016 #

    Hello! This Indicator is not working if i change the displayed time. if i set time for example in the dax from 08.00-22.15 it doesnt work anymore. is there a solution for this problem? thank you in advance

    • eisi • 03/25/2016 #

      Found the solution in a forum post from nicolas…thank you 🙂

  11. hua hin • 222 days ago #

    Bonjour merci pour votre contribution
    Comment changer les horaire je voudrai mettre l horaire de NY fuseau asie soit 21h30 merci j ai essayer de modifier les heures sur le scrip mais cela m indique RETURN Merci de votre concours

  12. desmondlua • 172 days ago #

    once maxii=undefined
    once minii=undefined
    once maxi1=undefined
    once mini1=undefined
    once maxi2=undefined
    once mini2=undefined
    once maxi3=undefined
    once mini3=undefined

    if time<093000 then
    maxi=high
    mini=low
    elsif time=093000 then
    maxi=max(high,maxi)
    mini=min(low,mini)
    lerange=(maxi-mini)/2
    midrange=(maxi+mini)/2

    else
    maxii=maxi
    minii=mini
    maxi1=maxi+lerange
    mini1=mini-lerange
    maxi2=maxi+2*lerange
    mini2=mini-2*lerange
    maxi3=maxi+3*lerange
    mini3=mini-3*lerange
    midrangei =midrange
    endif

    return maxii as “ORH”, minii as “ORL”, maxi1 as “UpperTarget1” ,mini1 as “LowerTarget1”,maxi2 as “UpperTarget2” ,mini2 as “LowerTarget2”,maxi3 as “UpperTarget3” ,mini3 as “LowerTarget3”, midrangei as “MiddleRange”

    Hi, I used the above 5-Min ORB indicator codes for US30 DOW Index, from 9.30am to 9.35am New York Time. Most of the days the ORH (Opening Range High) & ORL (Opening Range Low) are plotted correctly.
    However, I noted the ORH for 30-Dec-2024 was plotted incorrectly. It was using the 9.28am High as the ORH for 30-Dec-2024.
    May I know why? And how can I correct it? Thank you in advance.

avatar
Register or

Likes

avatar avatar avatar avatar avatar avatar avatar avatar avatar avatar avatar avatar avatar avatar
Related users ' posts
Bard Thanks for sharing this Verdi55. More instructions from Larry Williams website (and a fea...
Bard From the url link #post-65420 above but without the chart image: Stocks & Commodities...
Bard Note: lter = filter
Bard Apologies, there's been an issue with copying "f" and "I" from the article and pasting.. whi...
mcha Bonjour Nicolas J'ai mis cet indicateur sur une période graphique 1 heure. J'ai choisi 1...
marzibre Bonjour Nicolas. I work mainly on Daily timeframe. I was looking something similar but usi...
TraderGlyn This is an excellent indicator, it provides a hugely useful visual interpretation that filte...
YvesRobert Merci beaucoup Nicolas. Existe t'il un petit programme qui permet de tracer sur la graphe en...
Nicolas Oui il y a celui ci: https://market.prorealcode.com/product/prt-renko/?lang=fr
YvesRobert Bonjour Nicolas, j'ai une question technique à te poser. Je visualise souvent le cours en RE...
GenesisEX Thank you all for your contributions this is a great submission. Thanks for your inputs.
tino Bonjour nicolas. Je ne parviens pas à recopier le screener de l'indicateur. Auriez vous la g...
Nicolas Quel screener svp? C'est dans un des sujets du forum? Merci de fournir le lien.
Nicolas
7 years ago
Nicolas Merci, faire une demande dans le forum approprié.
Pere Thanks for this good indicator Nicolas. I would like to make the upper and lower limits mor...
Nicolas because fractals are known 2 bars later! that's why I used rectangle to plot them in the past.
Nicolas
7 years ago
Jurik RSX
v10.3
Jurik RSX
3
Indicators
hartgeld Hallo Nicolas, ein sehr guter Indikator, vielen Dank! Leider rechnet er bei mir nicht die Pe...
rigel Hi Nicolas, have you coded the Jurik alone (as Mov. average)?
Nicolas 2 versions available in this indicator: https://www.prorealcode.com/prorealtime-indicators/a...
supertiti Bonsoir à tous For those who like me want to calibrate this indicator on a scale of 0 to ...
gabri Ha ragione in computer, ho sbagliato io BullAD = summation[period](ADvolbull*((Close-Low) –...
marcov66 Perfetto! Funziona. Grazie di tutto!
SkrHugo Bonjour, J'essaye d'utiliser le script avec le graphique renko mais sa ne marche pas, quelq...
AG1 Thanks Nicolas Still a problem in line 29 Please take a look. thanks again Alex
Nicolas code is modified in the above post, use that one.
AG1 Still a problem in line 29 Please take a look. thanks again Alex
Tonicejudo Hola Nicolas, a ver si me puedes ayudar. Hay un indicador que se llama volumen stop de bolsa...
Nicolas Utilice los foros para hacer preguntas no relacionadas con la página actual ...
jebus89 Big thanks for sharing this :) Seems to work as expected, good stuff.
xpe74 Top visually, and very efficient. I would like to integrate it as a value in a small algo i...
Nicolas Sorry again, doing my best to fix this problem..
Gianluca Sorry but the 2° code that you posted have some problem it doesn't work
Leo I have to check
Alai-n I also have the same problem that I can not solve especially on LowVolume (Yellow) ... Sorry
Mert No need to apologise, my friend. It is great code. I hope you find a solution soon. Regards.
gabri I think it's because the lookback period changes at every new bar and that means that many c...
Vonasi Thanks for the compliments ALE. If you use any results from it in a strategy then please sha...
CKW this is Awesome tool. thanks Vonasi
Vonasi ....and thank you for the compliment CKW.
Reiner great work:-)
Vonasi Thanks Reiner. that is compliments indeed from the seasonality expert. I have a second vers...
Sagal Hi Vonasi, Can it be presented as a 1 year graph displaying a 5 year average or 10 year aver...
Vonasi I noticed a couple of typo errors in the code. The list of variables lines 4 to 11 should be...
Genotik Thank you for your important contribution this week which is much appreciated! Happy New Yea...
Vonasi No problem. I hope they are useful to someone. Happy and hopefully prosperous New Year to y...
DarioMazza Hi Vonasi, i have a question for you, the comand "pricetype" where did you found it in the ...
Vonasi PriceType is just a variable that I use. The value decides what type of price is used in the...
Vonasi I noticed a couple of typo errors in the code. The list of variables lines 4 to 11 should be...
Vonasi The indicator code can easily be adapted for use as a filter in strategies as well. For exam...
AVT Tested today in manual DAX trading (transcripted to MT and changed look into aka oszillator)...
Vonasi I think that short time frame charts will be too noisy for this indicator. One blue bar real...

Top