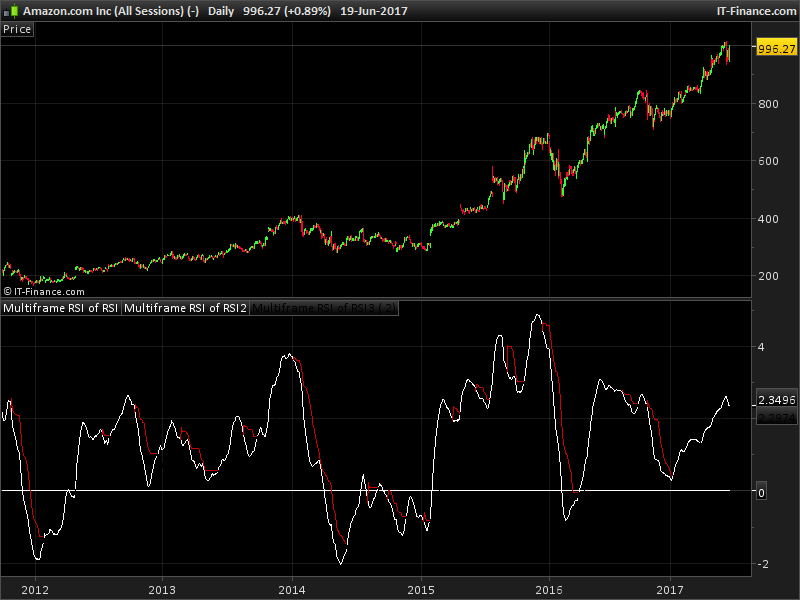
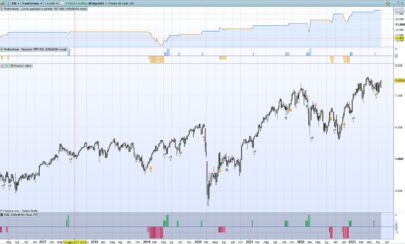
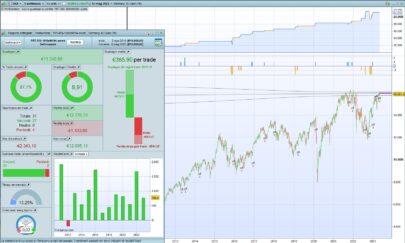
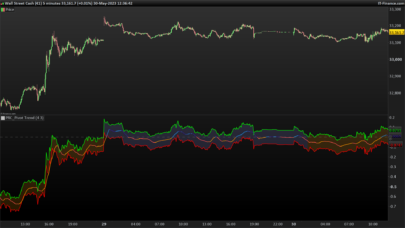
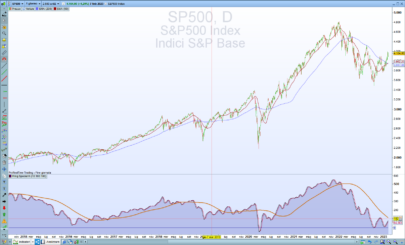
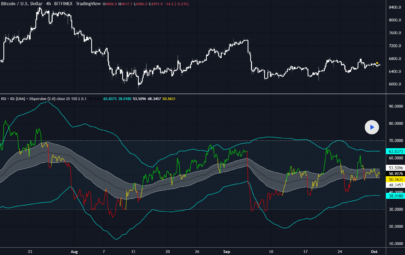
Since on a daily chart EMA26 approximate in an excellent way the 50-line of the RSI (when close crosses under EMA26 the RSI crosses under 50) and EMA130 approximate in the same way the 50-line of the weekly data on the daily chart, I created this indicator that so far gave me really good profits per trade.
It’s sort of a daily RSI of a weekly RSI and uses a cut-off line based on standard deviations to stop the position. I traded with it only long and only on stock market.
I enter long when the indicator crosses into the positive area (I normally use a number between 0.3 and 0.9) and I sell when the indicator crosses under the cut line (I use normally 1.5 to 1.9 of correction for the standard deviation)
Blue skies
|
1 2 3 4 5 6 7 8 9 10 11 12 13 14 15 16 17 18 19 20 21 22 23 24 25 26 27 28 29 30 31 32 33 34 35 |
//computation of moving averages and standard deviation //corr=2 a=exponentialaverage[130](close) b=exponentialaverage[26](a) diff=100*(a-b)/b st=std[22](diff) //computation of reference line (cut) if barindex>26 then basso=diff-corr*st alto=diff+corr*st once cut=basso if diff crosses under cut then cut=alto endif if diff crosses over cut then cut=basso endif if diff>cut then if basso>cut then cut=basso endif endif if diff<cut then if alto<cut then cut=alto endif endif if diff>cut then r=0 else r=205 endif endif //return of data return diff,0, cut coloured (r,0,0) |
Share this
No information on this site is investment advice or a solicitation to buy or sell any financial instrument. Past performance is not indicative of future results. Trading may expose you to risk of loss greater than your deposits and is only suitable for experienced investors who have sufficient financial means to bear such risk.
ProRealTime ITF files and other attachments :
Find other exclusive trading pro-tools on ![]()
PRC is also on YouTube, subscribe to our channel for exclusive content and tutorials


Hi Gabri, thanks for sharing, looks interesting and with potential as a basis for an Auto-strategy. Do you manual trade it or Auto-Trade?
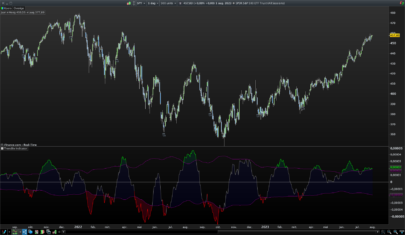
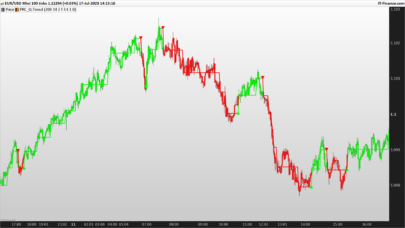
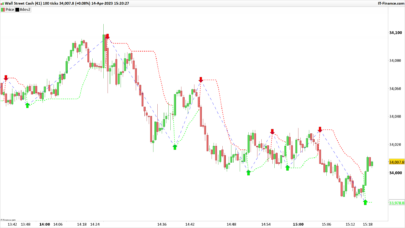
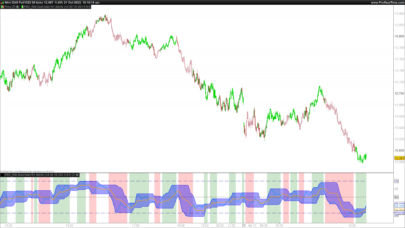
Link below shows what I get (I added more colours), not same as you show above … any comment / thoughts please?
Thank YouGraHal
GraHaL,
I cannot see any link attached. I mostly manual trade but for stocks with strong financials I used automatic trading with this setup as well. I had great results.
G
Yes sorry, I set up a link to a screen shot on my google drive and then I got locked into that weird thing where I kept getting shot down to the ‘bottom of the page’ and couldn’t get back to my post. I kept hitting return, space bar and all sorts in the end in frustration! I don’t want to bother Nicolas with it as he is so busy and he knows about this issue anyway … but he will read this sometime! 😉
Anyway ……. here is an ’embedded screen shot’ instead of a link … mmm can’t even do that now, this is so frustrating! Only way seems to be if you raise a Forum Thread??
Here’s the thread
https://www.prorealcode.com/topic/multiframe-rsi-of-rsi/
Bonjour Nicolas,
Pourriez-vous m’indiquer si cet indicateur fonctionne avec la V11 ? Le diff s’affiche seul dans un graph séparé avec ses deux lignes d’écart-type et c’est tout.
L’indicateur change d’ailleurs de nom au téléchargement : “mio – ema26 di ema26” et l’illustration en exemple est impossible à réaliser.
Je vous en remercie d’avance.