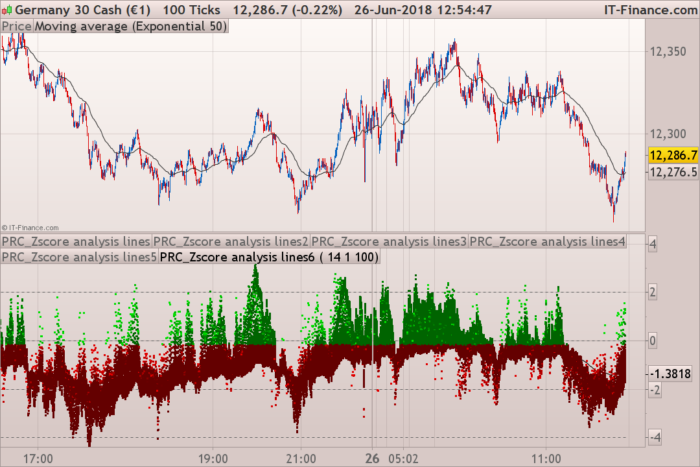
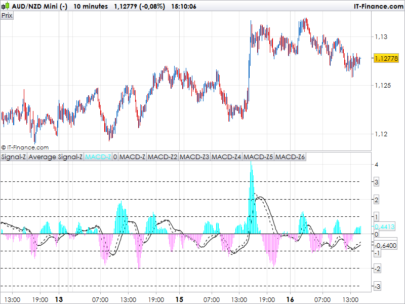
This indicator is a quick attempt to represent the distance of prices from their averages using the Zscore.
By using the DRAWTEXT graphical function in a loop, you can display a large amount of information at the same time.
The Zscore is calculated dynamically against several moving averages for as many “definition” periods. The variable “definition” is a multiplier.
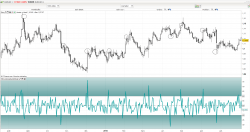
What the indicator shows us is that the price both to return more quickly to its mean when few Zscore (1 Zscore = 1 point on the graph) exceeds a deviation of 2 standard deviations and that quickly, while many other points form a compact package.
Other observations could be formulated for different types of graphs, time horizons and ways to trade, I leave you the pleasure to test by yourself 🙂
|
1 2 3 4 5 6 7 8 9 10 11 12 13 14 15 16 17 18 19 20 21 22 23 24 25 26 27 28 29 30 31 32 33 34 35 36 |
//PRC_multipleZscore analysis | indicator //26.06.2018 //Nicolas @ www.prorealcode.com //Sharing ProRealTime knowledge //--- settings period = 20 MAtype = 1 definition = 100 //--- end of settings globalz=0 for i = 1 to definition do avg = average[period*i,MAtype](customclose) st = std[period*i](customclose) zscore = (customclose-avg)/st if zscore<0 then r=255-(30*i) g=0 drawtext(".",barindex,zscore,Dialog,Bold,20) coloured(max(r,100),g,0) else r=0 g=255-(30*i) drawtext(".",barindex,zscore,Dialog,Bold,20) coloured(r,max(g,100),0) endif globalz=(globalz+zscore*i)/definition next smooth=average[period](globalz) RETURN 0 coloured(100,100,100) style(dottedline), 2 coloured(100,100,100) style(dottedline), -2 coloured(100,100,100) style(dottedline), 4 coloured(100,100,100) style(dottedline), -4 coloured(100,100,100) style(dottedline), smooth |
Share this
No information on this site is investment advice or a solicitation to buy or sell any financial instrument. Past performance is not indicative of future results. Trading may expose you to risk of loss greater than your deposits and is only suitable for experienced investors who have sufficient financial means to bear such risk.
ProRealTime ITF files and other attachments :
Find other exclusive trading pro-tools on ![]()
PRC is also on YouTube, subscribe to our channel for exclusive content and tutorials

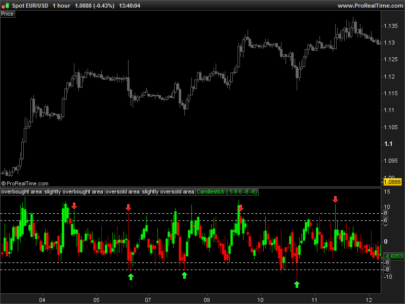


good job! when it comes to the 4 standard deviation the price almost always breaks in
Yes because the mean is also moving, it is not stationnary 🙂
I AM NOT VERY PRACTICAL … IS IT POSSIBLE TO MAKE THE SCREENER WHEN AT LEAST A BALL EXCEEDS FROM 4 DEVIATION?
Dear Alfapenna,
I would think the following 3 additions/changes in the code will do; however 4 is an extreme value .
if zscore <= -4 then (CHANGE INSTEAD OF = 4 then ( CHANGE ADDED LINE)
r=0
g=255-(30*i)
drawtext(“.”,barindex,zscore,Dialog,Bold,20) coloured(r,max(g,100),0)
endif
endif (CHANGE ADDED ADDITIONAL ENDIF)
Dear Alfapenna,
I just saw my reply of this morning to you, it is completely mixed up (?)
So I give it another try to answer your question:
however ZFactor of 4 is an extreme value .
if zscore< -4 then //ADJUSTED; was if zscore 4 then //NEW LINE
r=0
g=255-(30*i)
drawtext(“.”,barindex,zscore,Dialog,Bold,20) coloured(r,max(g,100),0)
endif
endif //NEW LINE
Nicolas,
thanks for the code.
“Smooth” does not seem to give any value (smooth=average[period](globalz))
If you can react on this, would be great !
KR Jan
But it should, I’ll test later.
Nicolas, maybe the cause is that the values of / or the smooth line is not visible (??)
Thanks for such a great job… I will try to use it in a trading system.
Really great
Is there a way to create a return value for the points so we can create alerts when some points are higher or lower of a value ? how can we modify the code to do that ?
So many variables to be returned! The indicator is dynamic by its settings, so you can’t know how much variables it would return, that’s why I used dots made with a graphic instruction. Zscore is pretty much the same as a standard deviation, so bollinger bands do already this job for you.
Has anyone found a solution for Sofitech? Would it be possible to draw two lines? An upper line for the maximum points and a lower line for the minimum points. Would that be possible?
Is this indicator for use in a binary sense or is it just a type of visual . If it is to be used as binary/boolean type signal what would your suggestion be ? It seems a little noisey to me , possibly i just dont get it .
Multiple zscore are plotted around many different time horizons means. Purely visual as you cant get a binary signal without any studies of all the information that are plotted by the indicator. As I wrote in the post, I let everyone make their own studies about the concept.
Hello Nicolas, my prt become stuck when i load the indicator, is there any problem with it?
Hm, i dont know exactly why, but I think, that the indicator needs lots of power. I need also lots of time to load it. Maybe your computer has not enaugh power for it?
Hello, would this be the same as doing close-moving average and just getting the z-score of that?
No, you will get a distance in points. Here is the definition of Z-score: The z-score, also known as the standard score, is a statistical measure that describes how many standard deviations a data point is from the mean of a dataset.
Thank you