






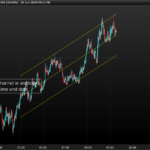
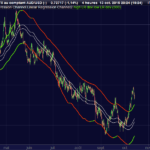
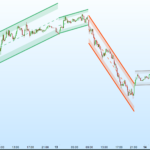
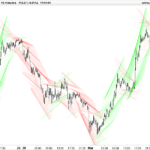
Linear Regression Channel with percent upper and lower lines

This channel is made of initial code by HK-LISSE to draw a linear regression. Coded by request, this modification is an attempt to draw the correct channel made with an upper and a lower lines deviated from the center by price percentage.
This code maybe of interest for anyone to make screeners and automated strategies around it, because there are no possibilities actually to call the values of the platform embedded same indicator.
Beware that the channel is moving at candle close and informations of the N+0 past channel would have not be the same in the past at N+10 periods for example.
//Parameters :
// Len = 100
// percent = 0.002

once j=0
de48=DPO[Len*2](close)
if de48=de48[1] and de48[1]=de48[2] and de48[2]<>de48[3] then
 flag=1
endif

n=(Len*2)-4
p=(n/2)-1
d100=DPO[n](close)
moy100=close-d100
co=(moy100-moy100[1]+(close[p])/n)*n
if flag=1 and flag[1]=0 then
 test=linearregression[Len](co)
 test1=linearregressionslope[Len](co)
 a=test1
 b=test-test1*Len
endif

if flag=0 then
 reg=undefined
 upperchan=undefined
 lowerchan=undefined
else
 j=j+1
 reg=a*j+b
 upperchan = reg + reg*percent
 lowerchan = reg - reg*percent
endif

RETURN reg as "channel center", upperchan as "upper channel", lowerchan as "lower channel"

Comments
You must be logged in to post a comment.


I wish to get a clearer unstanding of the theory behind this code. What does j=j+1 imply? Im going to start prorealcode but right now im switching between this and another programme where i need to translate the script but im having problems understanding the logic behind it. By the way, i love this indicator!

Bonjour Nicolas, Is there a way to dynamically vary the length of this indicator in realtime and still get it to display? I am only interested in the most recent "len" setting and understand that the indicator will change but I am unable to do this dynamically. If I set the length to 20 and leave it there over the entire period of measurement it works perfectly but if I change the length variable dynamically it does not display anything... Can this be done somehow? The issue can be replicated by replacing "len=100" with the following code (which just simply alternates between a period of 50 and 100): Once Len = 100 If Len = 100 then Len = 50 Else Len = 100 EndIf

Hi Nicolas, A very nice indicator. But I want to know how to calculate the correlation coefficient? It seems there is function called Correlation by ProRealTime?


hi nicolas compliments are very good and really helpful , version 10.3 when it's available ?

Tanks,
I tried to build a TS with this indicator but don't run. The idea is to enter long when the candle crosses the lower channel and enter short when the candle crosser th upper channel. For exit rules I think it's better when the price is > of channel center for long position and < of channel center for short position. I think to insert a stop loss equal to a % of ATR. I want to test it for a TF of 15 min. Can you aid me ? Tanks
Hello, Is it possible to updated the indicator to the more updated versione of ProrealTime? it does not plot the upper and lower channel ine, but only the centre. thank's in advance