







Value Chart Indicator
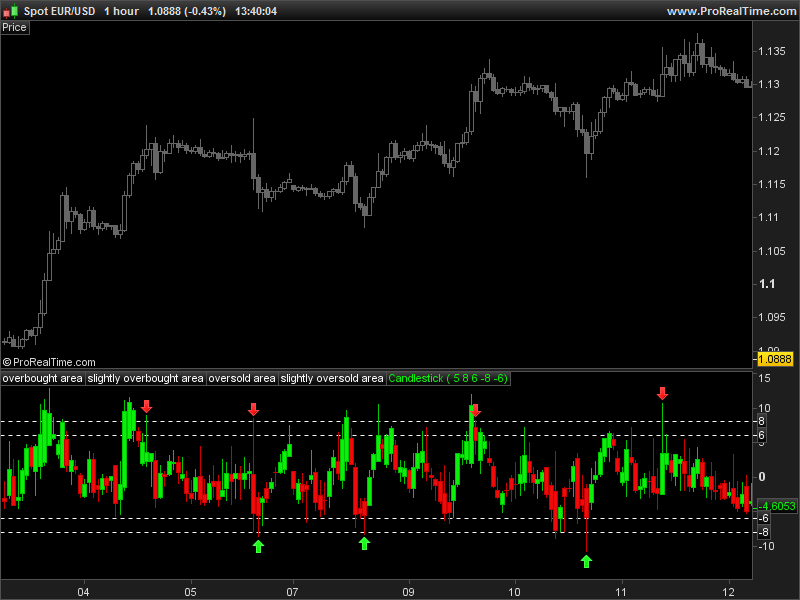
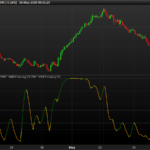
Here is the value chart indicator coded for the new ProRealTime v10.3 with custom candles made with DRAWCANDLE and alerts BUY/SELL arrows.
This indicator draw candlesticks over a normalized scale created dynamically from the last highest/lowest values over n period. It attempts to spot market oversold and overbought area on a short time scale, when price would revert to its mean value.
This kind of indicator is well used in binary options trading, in many different strategies.
When price make rebound over the oversold/overbought levels (candle spike rejection), arrows are drawn to specify trades entries.
//parameters :
//ExtDepth = 5
//Overbought = 8
//SlightlyOverbought = 6
//Oversold = -8
//SlightlyOversold = -6

if barindex>ExtDepth then
 sumHigh = summation[ExtDepth](high)
 sumLow = summation[ExtDepth](low)

 floatingaxis = 0.1 * (sumHigh+sumLow)
 volatilityunit = 0.04 * (sumHigh-sumLow)

 vcOpen = ((open-floatingaxis) / volatilityunit)
 vcClose =((close-floatingaxis) / volatilityunit)
 vcHigh = ((high-floatingaxis) / volatilityunit)
 vcLow = ((low-floatingaxis) / volatilityunit)

 if vcClose>vcOpen then
  DRAWCANDLE(vcOpen,vcHigh,vcLow,vcClose)coloured(10,240,10) bordercolor(0,200,0)
else
  DRAWCANDLE(vcOpen,vcHigh,vcLow,vcClose)coloured(240,10,10) bordercolor(200,0,0)
 endif

 if vcLow<Oversold and vcClose>SlightlyOversold then
  DRAWARROWUP(barindex,vcLow-0.5)coloured(10,255,10)
 endif

 if vcHigh>Overbought and vcClose<SlightlyOverbought then
  DRAWARROWDOWN(barindex,vcHigh+0.5)coloured(255,10,10)
 endif
endif

RETURN  Overbought COLOURED(250,250,250) STYLE(DOTTEDLINE,1)  as "overbought area", SlightlyOverbought COLOURED(250,250,250) STYLE(DOTTEDLINE,1) as "slightly overbought area", Oversold COLOURED(250,250,250) STYLE(DOTTEDLINE,1) as "oversold area", SlightlyOversold COLOURED(250,250,250) STYLE(DOTTEDLINE,1) as "slightly oversold area"
Comments
You must be logged in to post a comment.






Ok, if you tell it, I believe you ! Your work is great you have a real experience in trading so i listen to you ! Thank you ! have a nice day !
My question was about how work the value chart, because thank's to my research i think that the MBFX timing is a king of value chart but apply to the Gravity Center.
Knowing how work this indicator could help me !
I have took contact with doc trading and he is agreed to programme this indicator if i find the formula !
Thank's for your answer !
(Sorry for my english , i'm not already fluent in english but i try to improve it )
Don't waste your time, the MBFX timing is nothing else than a stochastic oscillator. This indicator is a pure commercial repackage of an already best-known indicator, a so-called "scam". In fact, the MBFX came after the gravity center to find better entry points to the mean-revert function of the GC. Stochastic like RSI or any other bounded indicator try to identify the center point of price and so draw its deviations. You should investigate on how indicators work and why and for what they were made instead of follow them blindfolded, believe me you will learn a lot! :)
Hi dear nicolas,
Your work is awesome !
I'm interessed by the mathematical formula of the value chart, if it's possible and if isn't a problem for you, Could i take contact with you ?
I want to know how this indicator work to programme an other indicator.
Yours Sincerely
Vincent Regnault

Hi Nicolas, thank you for your answer . I'm using the 10.3 beta version (end of day data), and I really can't draw anything (segment, line, arrow ....).I'm a quite skill with the code, but in this area, very interesting for me (I'm now using for forex trade, metatrader), I'm not able to visualize graphical object.
Cristiano

i have the v10.2 version of this. I've been working on a automated strategy containing this indicator. Anyone more that had those thoughts?

Hello Nicolas,
it`s me again. Maybe you know the answer. Is it possible to make a alarm for the down arrow and up arrow. I don't find a possibility in version 10.3, because there is no option for the arrows. Or I change it and say for example: add 100 for the uparrow and make a alarm >100. but this would be a temporary solution ;)
best wishes
Hi Nicolas, thank you for your answer . I'm using the 10.3 beta version (end of day data), and I really can't draw anything (segment, line, arrow ....)
I'm a quite skill with the code, but in this area, very interesting for me (I'm now using for forex trade, metatrader), I'm not able to visualize graphical object.
Cristiano
Hi Cristiano, this indicator is intended to work only from the new version 10.3 of ProRealTime. There is another version of this one for version 10.2 here: http://www.prorealcode.com/prorealtime-indicators/value-chart-highlow/ But it doesn't have arrows signals which are the newest graphical capabilities of the new version.
WE NEED THIS IN MQL4 OR EX4