
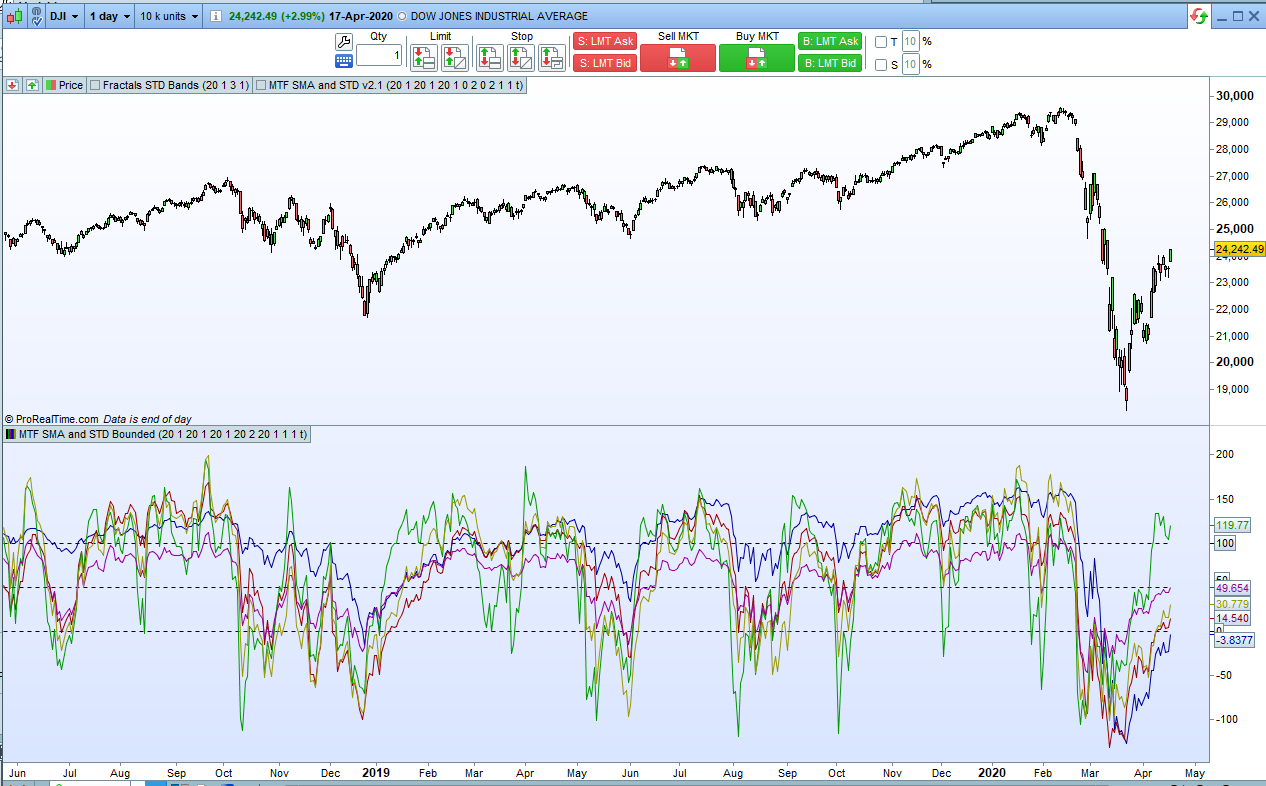
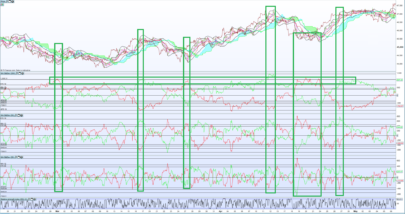
This indicator is a bounded version of my Multi Time Frame Simple Moving Average and Standard Deviation Bands indicator.
The indicator allows you to calculate simple moving averages and standard deviation bands (Bollinger Bands) from up to five different time frames. The indicator then shows where price is with each of these sets of bands as they are bounded around zero and 100 where zero represents the lower standard deviation band in each time frame and 100 represents the upper standard deviation band in each time frame.
This indicator only works with PRTv11 onwards.
You set the average period and number of standard deviations for the bands with the various ‘p’ and ‘dev’ settings.
- Mp – Monthly average period
- MDev – Monthly deviations
- Wp – Weekly average period
- WDev – Weekly deviations.
- Dp – Daily average period
- DDev – Daily deviations.
- HRp – Hourly average period
- HRDev – Hourly deviations.
- MIp – Minutes average period
- MIDev – Minutes deviations.
If putting Hourly or Minute lines in the indicator then you also need to set HRQty and MIQty to the number of hours or minutes. So for example set HRQTY to 4 to display the price line within its standard deviation bands from the 4 hour chart. Set the p value of any line that you don’t want to draw to zero – this also helps the indicator calculate slightly quicker.
The ‘EveryBar’ setting allows to to either just update the calculations of values at the close of each bar on their slower time frame chart or if ‘EveryBar’ is set then the lines update on every bar of the chart that you are viewing them on.
You can turn individual lines on and off and change their colour in the indicator configure window.
You can also select whether the lines are calculated on close, high, low, median price etc in the indicator configure window.
As always I advise downloading and importing the ITF file to get full functionality.
|
1 2 3 4 5 6 7 8 9 10 11 12 13 14 15 16 17 18 19 20 21 22 23 24 25 26 27 28 29 30 31 32 33 34 35 36 37 38 39 40 41 42 43 44 45 46 47 48 49 50 51 52 53 54 55 56 57 58 59 60 61 62 63 64 65 66 67 68 69 70 71 72 73 74 75 76 77 78 79 80 81 82 83 84 85 86 87 88 89 90 91 92 93 94 95 96 97 98 99 100 101 102 103 104 105 106 107 108 109 110 111 112 113 114 115 116 117 118 119 120 121 122 123 124 125 126 127 128 129 130 131 132 133 134 135 136 137 138 139 140 141 142 143 144 145 146 147 148 149 150 151 152 153 154 155 156 157 158 159 160 161 162 163 164 165 166 167 168 169 170 171 172 173 174 175 176 177 178 179 180 181 182 183 184 185 186 187 188 189 190 191 192 193 194 195 196 197 198 199 200 201 202 203 204 205 206 207 208 209 210 211 212 213 214 215 216 217 218 219 220 221 222 223 224 225 |
//Multi Time Frame SMA and STD Bounded //By Vonasi //Date: 20200420 //Mp = 20 //Monthly SMA period //Wp = 20 //Weely SMA period //Dp = 20 //Dailly SMA period //HRp = 20 //Hourly SMA period //MIp = 20 //Minute SMA period //Mdev = 2 //Number of deviations for Monthly bands //Wdev = 2 //Number of deviations for Weekly bands //Ddev = 2 //Number of deviations for Daily bands //HRdev = 2 //Number of deviations for Hourly bands //Midev = 2 //Number of deviations for Minute bands //HRqty= 1 //Which Hour time frame //MIqty= 1 //Which minute time frame //EveryBar = 1 //Calculate new SMA on every bar or only update on close once Mupper = undefined once Mlower = undefined once Mavg = undefined once Wupper = undefined once Wlower = undefined once Wavg = undefined once Dupper = undefined once Dlower = undefined once Davg = undefined once HRupper = undefined once HRlower = undefined once HRavg = undefined once Miupper = undefined once Milower = undefined once Miavg = undefined //store each occurance if Mp then if openmonth <> openmonth[1] then Ma = Ma+1 $Mprice[Ma] = customclose[1] endif endif if Wp then if opendayofweek < opendayofweek[1] then Wa = Wa+1 $Wprice[Wa] = customclose[1] endif endif if Dp then if opendayofweek <> opendayofweek[1] then Da = Da+1 $Dprice[Da] = customclose[1] endif endif if HRp then if openhour <> openhour[1] and openhour mod HRqty = 0 then HRa = HRa+1 $HRprice[Hra] = customclose[1] endif endif if Mip then if openminute <> openminute[1] and openminute mod MIqty = 0 then Mia = Mia+1 $Miprice[Mia] = customclose[1] endif endif if Ma+1 >= Mp then if everybar and Mp then $Mprice[Ma+1] = customclose total = 0 for b = Ma+1 downto Ma-Mp+2 total = total + $Mprice[b] next Mavg = total/Mp total = 0 for b = Ma+1 downto Ma-Mp+2 total = total + (square($Mprice[b]-Mavg)) next endif if not everybar and Mp then total = 0 for b = Ma downto Ma-Mp+1 total = total + $Mprice[b] next Mavg = total/Mp total = 0 for b = Ma downto Ma-Mp+1 total = total + (square($Mprice[b]-Mavg)) next endif Mstdev = sqrt(total/Mp) endif if Wa+1 >= Wp then if everybar and Wp then $Wprice[Wa+1] = customclose total = 0 for b = Wa+1 downto Wa-Wp+2 total = total + $Wprice[b] next Wavg = total/Wp total = 0 for b = Wa+1 downto Wa-Wp+2 total = total + (square($Wprice[b]-Wavg)) next endif if not everybar and Wp then total = 0 for b = Wa downto Wa-Wp+1 total = total + $Wprice[b] next Wavg = total/Wp total = 0 for b = Wa downto Wa-Wp+1 total = total + (square($Wprice[b]-Wavg)) next endif Wstdev = sqrt(total/Wp) endif if Da+1 >= Dp then if everybar and Dp then $Dprice[Da+1] = customclose total = 0 for b = Da+1 downto Da-Dp+2 total = total + $Dprice[b] next Davg = total/Dp total = 0 for b = Da+1 downto Da-Dp+2 total = total + (square($Dprice[b]-Davg)) next endif if not everybar and Dp then total = 0 for b = Da downto Da-Dp+1 total = total + $Dprice[b] next Davg = total/Dp total = 0 for b = Da downto Da-Dp+1 total = total + (square($Dprice[b]-Davg)) next endif Dstdev = sqrt(total/Dp) endif if HRa+1 >= HRp then if everybar and HRp then $HRprice[HRa+1] = customclose total = 0 for b = HRa+1 downto HRa-HRp+2 total = total + $HRprice[b] next HRavg = total/HRp total = 0 for b = HRa+1 downto HRa-HRp+2 total = total + (square($HRprice[b]-HRavg)) next else total = 0 for b = HRa downto HRa-HRp+2 total = total + $HRprice[b] next HRavg = total/HRp total = 0 for b = HRa downto HRa-HRp+1 total = total + (square($HRprice[b]-HRavg)) next endif HRstdev = sqrt(total/HRp) endif if Mia+1 >= Mip then if everybar and Mip then $Miprice[Mia+1] = customclose total = 0 for b = Mia+1 downto Mia-Mip+2 total = total + $Miprice[b] next Miavg = total/Mip total = 0 for b = Mia+1 downto Mia-Mip+2 total = total + (square($Miprice[b]-Miavg)) next else total = 0 for b = Mia downto Mia-Mip+2 total = total + $Miprice[b] next Miavg = total/Mip total = 0 for b = Mia downto Mia-Mip+1 total = total + (square($Miprice[b]-Miavg)) next endif Mistdev = sqrt(total/Mip) endif //calculate bands Mupper = Mavg + (Mstdev*Mdev) Wupper = Wavg + (Wstdev*Wdev) Dupper = Davg + (Dstdev*Ddev) HRupper = HRavg + (HRstdev*HRdev) Miupper = Miavg + (Mistdev*MIdev) Mlower = Mavg - (Mstdev*Mdev) Wlower = Wavg - (Wstdev*Wdev) Dlower = Davg - (Dstdev*Ddev) HRlower = HRavg - (HRstdev*HRdev) Milower = Miavg - (Dstdev*MIdev) MPerc = ((customclose-Mlower)/(Mupper-Mlower))*100 WPerc = ((customclose-Wlower)/(Wupper-Wlower))*100 DPerc = ((customclose-Dlower)/(Dupper-Dlower))*100 HRPerc = ((customclose-HRLower)/(HRupper-HRlower))*100 MiPerc = ((customclose-MiLower)/(Miupper-Milower))*100 return 0 as "0",50 as "50",100 as "100",MPerc as "Monthly",WPerc as "Weekly",DPerc as "Daily",HRPerc as "Hourly",MiPerc as "Minutes"//Mupper as "Month Upper STD Band", Mlower as "Month Lower STD Band", Mavg as "Month SMA", Wupper as "Week Upper STD Band", Wlower as "Week Lower STD Band", Wavg as "Week SMA", Dupper as "Day Upper STD Band", Dlower as "Day Lower STD Band", Davg as "Day SMA", HRupper as "Hour Upper STD Band", HRlower as "Hour Lower STD Band", HRavg as "Hour SMA", Miupper as "Minute Upper STD Band", Milower as "Minute Lower STD Band", Miavg as "Minute SMA" |
Share this
No information on this site is investment advice or a solicitation to buy or sell any financial instrument. Past performance is not indicative of future results. Trading may expose you to risk of loss greater than your deposits and is only suitable for experienced investors who have sufficient financial means to bear such risk.
ProRealTime ITF files and other attachments :
Find other exclusive trading pro-tools on ![]()
PRC is also on YouTube, subscribe to our channel for exclusive content and tutorials


There are actually two ways to calculate standard deviations and I seem to have used the version for calculations on populations rather than on data samples. There is only a tiny difference between them but if you want a modified code then you can find it here; https://www.prorealcode.com/topic/standard-deviation-indicators-minor-fix/