1) What is the Multi-DSMA?
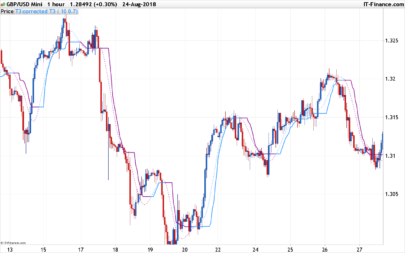
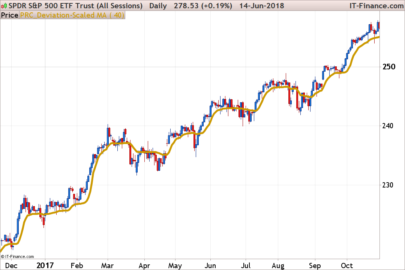
The Multi Deviation Scaled Moving Average (by ChartPrime) is an adaptive moving average that stacks eight Deviation-Scaled MAs (DSMAs) with progressively longer lookbacks. Each DSMA self-adjusts to current market activity via RMS scaling, then all eight are averaged into a single line. A score gauges how many fast layers are above the slowest layer, driving dynamic color/opacity and generating early/late crossover signals.
Use it when you need a trend-aware line that reacts quickly in acceleration phases but remains calm in choppy markets.
2) How it Works — The Short Version
Pipeline per bar:
-
Super Smoother prefilter → noise reduction with low lag.
-
RMS scaling (via exponential average) → dimensionless, volatility-aware signal.
-
Adaptive alpha → bigger |signal| ⇒ faster DSMA; clamped to avoid overshoot.
-
Eight DSMA layers → periods =
Periods + k×step(k = 0..7). -
Average of 8 layers → final “Multi DSMA Avg” line.
-
Score (0–1) → fraction of fast layers above the slowest layer.
-
Color/Opacity from score + Signals at 0.30/0.70 crossovers.
3) Core Mechanics
3.1 Super Smoother (per layer)
Each layer takes a zero-mean input (close - close[2]) and runs it through a 2-pole Super Smoother (Ehlers-style) using period-dependent coefficients. This removes high-frequency noise without the lag typical of simple MAs.
3.2 RMS Normalization
rms = sqrt(ExponentialAverage(period)(filt^2))
Dividing the filtered signal by its RMS (scaledFilt) makes the amplitude comparable across regimes (quiet vs. volatile), so the adaption depends on structure, not raw volatility.
3.3 Adaptive DSMA
alpha = min( |scaledFilt| * 5 / period , 1 )DSMA = alpha * close + (1 - alpha) * DSMA[1]
When structure builds (|scaled| ↑), alpha increases and the DSMA hugs price more tightly. In calm conditions, alpha shrinks and the line smooths out.
3.4 The Eight Layers & Sensitivity Inversion
-
Base period =
Periods. -
Step =
max(100 - Sensitivity, 1)→ higher Sensitivity ⇒ smaller step ⇒ layers are closer together ⇒ more responsiveness. -
Layer periods:
Periods, Periods+step, ..., Periods+7×step.
3.5 Multi-Layer Average
The plotted line “Multi DSMA Avg” is the simple average of the 8 DSMA values. This blend keeps the agility of fast layers while anchoring to the slower context.
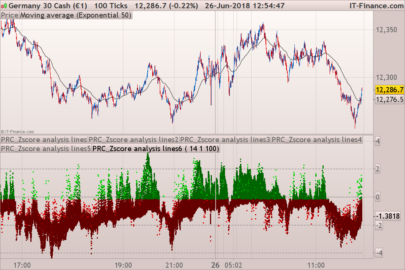
3.6 Score Construction (0–1)
Compare each of the seven fast layers to the slowest (DSMA8). Each fast-above-slow adds ≈ 1/7.
-
Score ≈ 1 → strong bullish stack (broad alignment).
-
Score ≈ 0 → strong bearish stack.
-
Middle → mixed/transition.
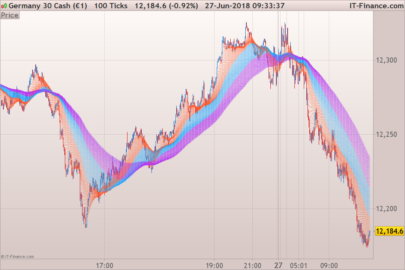
3.7 Dynamic Color & Opacity
-
If score > 0.5: gradient fades in towards the upper color (bullish).
-
If score ≤ 0.5: gradient fades out from the down color (bearish).
Opacity follows the same logic: conviction (stack agreement) literally shows up as a more opaque line.
3.8 Signals (Hysteresis Band)
-
Bullish signal when score crosses up 0.30 → early heads-up.
-
Bearish signal when score crosses down 0.70 → late confirmation.
This asymmetric band reduces flip-flops by asking for more evidence before flipping bearish.
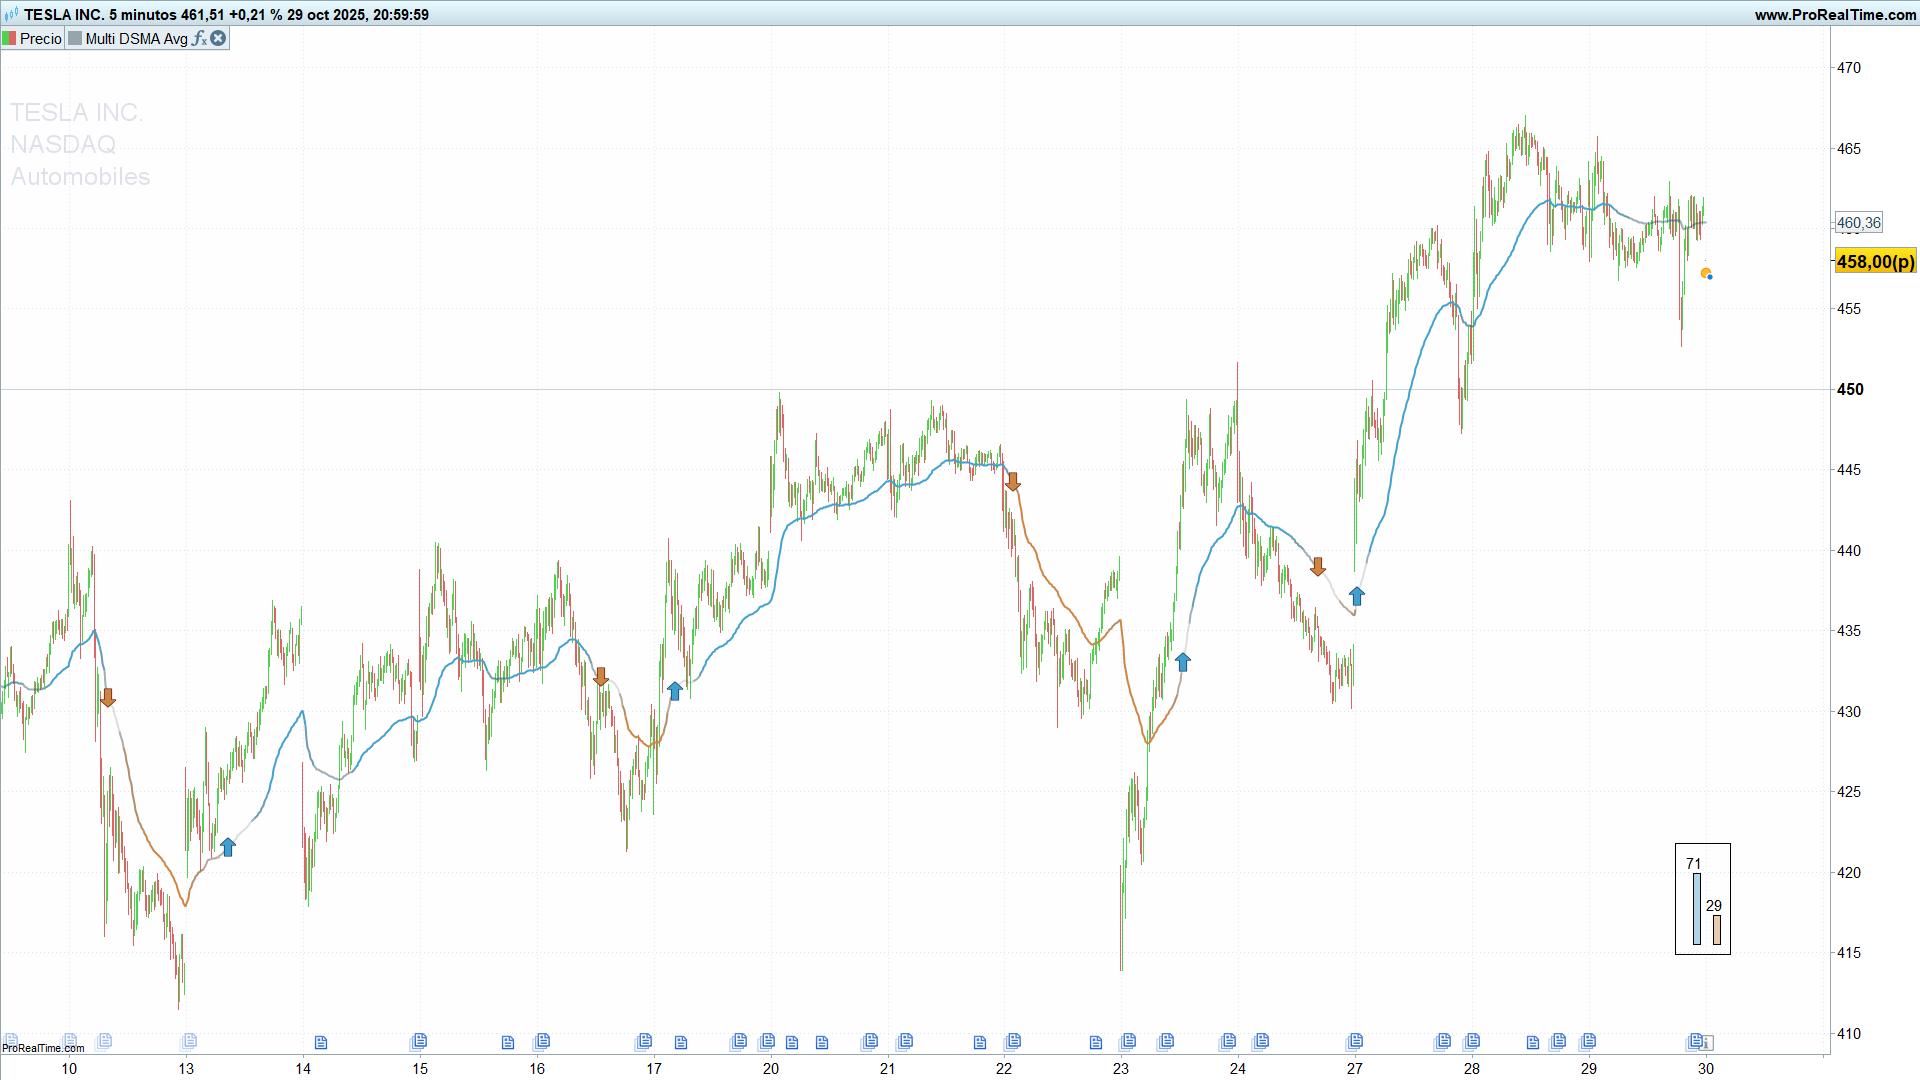
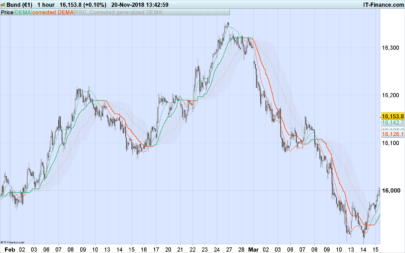
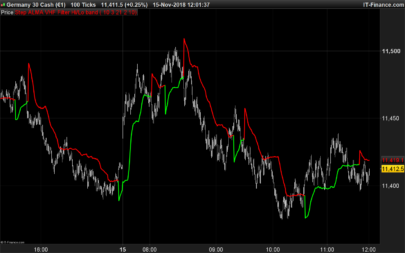
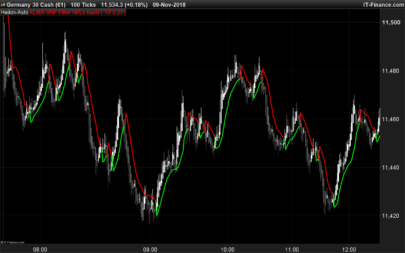
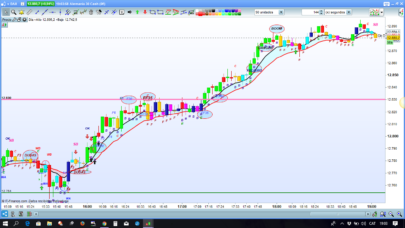
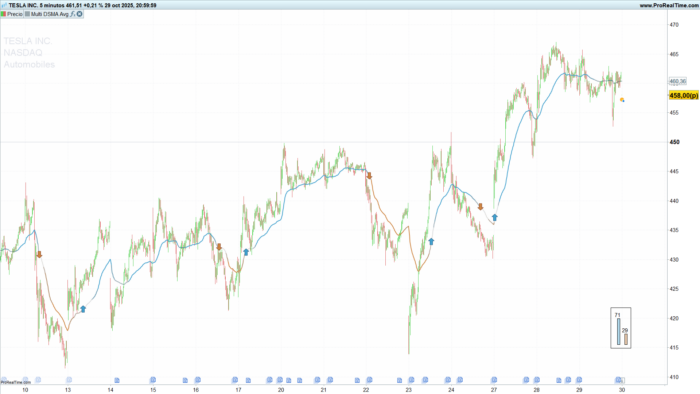
4) How to Read It on the Chart
-
Line direction: trend bias of the blended stack.
-
Color & opacity: confidence. Deeper/denser = stronger alignment.
-
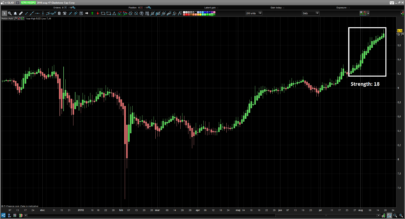
Arrows:
-
▲ at the Multi DSMA Avg when score crosses above 0.30.
-
▼ at the Multi DSMA Avg when score crosses below 0.70.
-
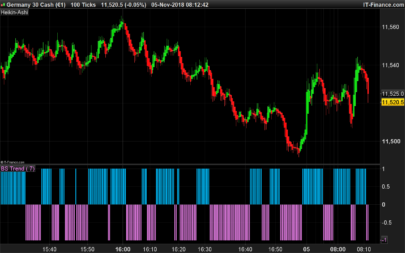
-
On-chart panel (last bar): two vertical bars show Up% vs Down% (score×100 vs 100–score×100), updated on the most recent update.
Tip: The score panel uses anchored drawing near the bottom-right of the chart. If you customize positions, keep the
anchor(bottomright, xshift, yshift)logic consistent.
5) Typical Uses
A) Trend Confirmation / Bias Filter
-
Trade only long when score > 0.5 and line slopes up; short when < 0.5 and slope down.
-
Use arrows as timing aids, not stand-alone entries.
B) Momentum Entries
-
Aggressive: act on the ▲ (0.30 cross up) if the line is already turning up and price pulls back to or slightly below the line.
-
Conservative: wait for price to reclaim the line and the score to sustain > 0.6 for several bars.
C) Exits / Risk Control
-
Partial exit when score slips below 0.7 from high levels (momentum fading).
-
Hard exit on ▼ (0.70 cross down) and line turning flat/down.
D) Multi-Timeframe
-
Use higher timeframe score as bias; execute with lower timeframe ▲/▼ around the Multi DSMA Avg.
This indicator is non-repainting (no future data; all calculations use current and past bars).
6) Inputs & Configuration
Periods (default 30)
-
Sets the base lookback.
-
Lower (e.g., 14–25): faster, more responsive, more signals.
-
Higher (e.g., 40–80): smoother trend backbone, fewer signals.
Sensitivity (default 60, range 0–100)
-
Controls step via
step = max(100 - Sensitivity, 1). -
Higher Sensitivity ⇒ smaller step ⇒ layers cluster ⇒ more agility.
-
Lower Sensitivity ⇒ larger step ⇒ wider spread ⇒ stronger “stack” requirement.
Recommended starting points:
-
Scalping:
Periods 20–30,Sensitivity 70–85 -
Swing:
Periods 30–50,Sensitivity 55–70 -
Position:
Periods 50–80,Sensitivity 40–60
Colors (RGB triplets)
-
Upper color for bullish gradients, Down color for bearish.
-
You can soften opacity extremes by lowering the alpha scaling, but the default provides a clear conviction cue.
7) ProBuilder Code
|
1 2 3 4 5 6 7 8 9 10 11 12 13 14 15 16 17 18 19 20 21 22 23 24 25 26 27 28 29 30 31 32 33 34 35 36 37 38 39 40 41 42 43 44 45 46 47 48 49 50 51 52 53 54 55 56 57 58 59 60 61 62 63 64 65 66 67 68 69 70 71 72 73 74 75 76 77 78 79 80 81 82 83 84 85 86 87 88 89 90 91 92 93 94 95 96 97 98 99 100 101 102 103 104 105 106 107 108 109 110 111 112 113 114 115 116 117 118 119 120 121 122 123 124 125 126 127 128 129 130 131 132 133 134 135 136 137 138 139 140 141 142 143 144 145 146 147 148 149 150 151 152 153 154 155 156 157 158 159 160 161 162 163 164 165 166 167 168 169 170 171 172 173 174 175 176 177 178 179 180 181 182 183 184 185 186 187 188 189 190 191 192 193 194 195 196 197 198 199 200 201 202 203 204 205 206 207 208 209 210 211 212 213 214 215 216 217 218 219 220 221 222 223 224 225 226 227 228 229 230 231 232 233 234 235 236 237 238 239 240 241 242 243 244 245 246 247 248 249 250 251 252 253 254 255 256 257 258 259 260 261 262 263 264 265 266 267 268 269 270 271 272 273 274 275 276 277 278 279 280 281 282 283 284 285 286 287 288 289 290 291 292 293 294 295 296 297 298 299 300 301 302 303 304 305 306 307 308 309 310 311 312 313 314 315 316 317 318 319 320 321 322 323 324 325 326 327 328 329 330 331 332 333 334 335 336 337 338 339 340 341 342 343 344 345 346 |
//---------------------------------------------------- //PRC_Multi Deviation Scaled Moving Average by ChartPrime //version = 0 //28.10.2025 //Iván González @ www.prorealcode.com //Sharing ProRealTime knowledge //---------------------------------------------------- // USER INPUTS //---------------------------------------------------- Periods = 30 // Period (Default: 30) Sensitivity = 60 // Sensitivity (0-100), Higher = More Sensitive (Default: 60) // Visualization Colors (RGB) upperColorR = 65 upperColorG = 161 upperColorB = 206 downColorR = 206 downColorG = 133 downColorB = 65 //---------------------------------------------------- // INDICATOR CALCULATIONS //---------------------------------------------------- // --- DSMA Calculation Setup --- // Invert sensitivity and ensure step is at least 1 step = 100 - Sensitivity IF step < 1 THEN step = 1 ENDIF //---------------------------------------------------- pi = 3.1415926535897932 g = SQRT(2) ONCE filt1 = 0 ONCE filt2 = 0 ONCE filt3 = 0 ONCE filt4 = 0 ONCE filt5 = 0 ONCE filt6 = 0 ONCE filt7 = 0 ONCE filt8 = 0 ONCE dsmaVal1 = typicalprice ONCE dsmaVal2 = typicalprice ONCE dsmaVal3 = typicalprice ONCE dsmaVal4 = typicalprice ONCE dsmaVal5 = typicalprice ONCE dsmaVal6 = typicalprice ONCE dsmaVal7 = typicalprice ONCE dsmaVal8 = typicalprice //---------------------------------------------------- // --- Calculate DSMA 1 --- if barindex > periods then // Smooth with a Super Smoother currentPeriods = Periods s = 2 * pi / currentPeriods a1 = EXP(-g * pi / (0.5 * currentPeriods)) b1 = 2 * a1 * COS((g * s / (0.5 * currentPeriods)) * 180 / pi) c2 = b1 c3 = -a1 * a1 c1 = 1 - c2 - c3 zeros = close - close[2] filt1 = c1 * (zeros + zeros[1]) / 2 + c2 * filt1[1] + c3 * filt1[2] rms1 = SQRT(ExponentialAverage[currentPeriods](SQUARE(filt1))) IF rms1 <> 0 THEN scaledFilt1 = filt1 / rms1 ELSE scaledFilt1 = 0 ENDIF alpha1 = ABS(scaledFilt1) * 5 / currentPeriods IF alpha1 > 1 THEN // Clamp alpha alpha1 = 1 ENDIF dsmaVal1 = alpha1 * close + (1 - alpha1) * dsmaVal1[1] endif //---------------------------------------------------- // --- Calculate DSMA 2 --- if barindex>Periods + step then currentPeriods = Periods + step s = 2 * pi / currentPeriods a1 = EXP(-g * pi / (0.5 * currentPeriods)) b1 = 2 * a1 * COS((g * s / (0.5 * currentPeriods)) * 180 / pi) c2 = b1 c3 = -a1 * a1 c1 = 1 - c2 - c3 zeros = close - close[2] filt2 = c1 * (zeros + zeros[1]) / 2 + c2 * filt2[1] + c3 * filt2[2] rms2 = SQRT(ExponentialAverage[currentPeriods](SQUARE(filt2))) IF rms2 <> 0 THEN scaledFilt2 = filt2 / rms2 ELSE scaledFilt2 = 0 ENDIF alpha2 = ABS(scaledFilt2) * 5 / currentPeriods IF alpha2 > 1 THEN // Clamp alpha alpha2 = 1 ENDIF dsmaVal2 = alpha2 * close + (1 - alpha2) * dsmaVal2[1] endif //---------------------------------------------------- // --- Calculate DSMA 3 --- if barindex > Periods + 2 * step then currentPeriods = Periods + 2 * step s = 2 * pi / currentPeriods a1 = EXP(-g * pi / (0.5 * currentPeriods)) b1 = 2 * a1 * COS((g * s / (0.5 * currentPeriods)) * 180 / pi) c2 = b1 c3 = -a1 * a1 c1 = 1 - c2 - c3 zeros = close - close[2] filt3 = c1 * (zeros + zeros[1]) / 2 + c2 * filt3[1] + c3 * filt3[2] rms3 = SQRT(ExponentialAverage[currentPeriods](SQUARE(filt3))) IF rms3 <> 0 THEN scaledFilt3 = filt3 / rms3 ELSE scaledFilt3 = 0 ENDIF alpha3 = ABS(scaledFilt3) * 5 / currentPeriods IF alpha3 > 1 THEN // Clamp alpha alpha3 = 1 ENDIF dsmaVal3 = alpha3 * close + (1 - alpha3) * dsmaVal3[1] endif //---------------------------------------------------- // --- Calculate DSMA 4 --- if barindex>Periods + 3 * step then currentPeriods = Periods + 3 * step s = 2 * pi / currentPeriods a1 = EXP(-g * pi / (0.5 * currentPeriods)) b1 = 2 * a1 * COS((g * s / (0.5 * currentPeriods)) * 180 / pi) c2 = b1 c3 = -a1 * a1 c1 = 1 - c2 - c3 zeros = close - close[2] filt4 = c1 * (zeros + zeros[1]) / 2 + c2 * filt4[1] + c3 * filt4[2] rms4 = SQRT(ExponentialAverage[currentPeriods](SQUARE(filt4))) IF rms4 <> 0 THEN scaledFilt4 = filt4 / rms4 ELSE scaledFilt4 = 0 ENDIF alpha4 = ABS(scaledFilt4) * 5 / currentPeriods IF alpha4 > 1 THEN // Clamp alpha alpha4 = 1 ENDIF dsmaVal4 = alpha4 * close + (1 - alpha4) * dsmaVal4[1] endif //---------------------------------------------------- // --- Calculate DSMA 5 --- if barindex>Periods + 4 * step then currentPeriods = Periods + 4 * step s = 2 * pi / currentPeriods a1 = EXP(-g * pi / (0.5 * currentPeriods)) b1 = 2 * a1 * COS((g * s / (0.5 * currentPeriods)) * 180 / pi) c2 = b1 c3 = -a1 * a1 c1 = 1 - c2 - c3 zeros = close - close[2] filt5 = c1 * (zeros + zeros[1]) / 2 + c2 * filt5[1] + c3 * filt5[2] rms5 = SQRT(ExponentialAverage[currentPeriods](SQUARE(filt5))) IF rms5 <> 0 THEN scaledFilt5 = filt5 / rms5 ELSE scaledFilt5 = 0 ENDIF alpha5 = ABS(scaledFilt5) * 5 / currentPeriods IF alpha5 > 1 THEN // Clamp alpha alpha5 = 1 ENDIF dsmaVal5 = alpha5 * close + (1 - alpha5) * dsmaVal5[1] endif //---------------------------------------------------- // --- Calculate DSMA 6 --- if barindex>Periods+5*step then currentPeriods = Periods + 5 * step s = 2 * pi / currentPeriods a1 = EXP(-g * pi / (0.5 * currentPeriods)) b1 = 2 * a1 * COS((g * s / (0.5 * currentPeriods)) * 180 / pi) c2 = b1 c3 = -a1 * a1 c1 = 1 - c2 - c3 zeros = close - close[2] filt6 = c1 * (zeros + zeros[1]) / 2 + c2 * filt6[1] + c3 * filt6[2] rms6 = SQRT(ExponentialAverage[currentPeriods](SQUARE(filt6))) IF rms6 <> 0 THEN scaledFilt6 = filt6 / rms6 ELSE scaledFilt6 = 0 ENDIF alpha6 = ABS(scaledFilt6) * 5 / currentPeriods IF alpha6 > 1 THEN // Clamp alpha alpha6 = 1 ENDIF dsmaVal6 = alpha6 * close + (1 - alpha6) * dsmaVal6[1] endif //---------------------------------------------------- // --- Calculate DSMA 7 --- if barindex>periods+6*step then currentPeriods = Periods + 6 * step s = 2 * pi / currentPeriods a1 = EXP(-g * pi / (0.5 * currentPeriods)) b1 = 2 * a1 * COS((g * s / (0.5 * currentPeriods)) * 180 / pi) c2 = b1 c3 = -a1 * a1 c1 = 1 - c2 - c3 zeros = close - close[2] filt7 = c1 * (zeros + zeros[1]) / 2 + c2 * filt7[1] + c3 * filt7[2] rms7 = SQRT(ExponentialAverage[currentPeriods](SQUARE(filt7))) IF rms7 <> 0 THEN scaledFilt7 = filt7 / rms7 ELSE scaledFilt7 = 0 ENDIF alpha7 = ABS(scaledFilt7) * 5 / currentPeriods IF alpha7 > 1 THEN // Clamp alpha alpha7 = 1 ENDIF dsmaVal7 = alpha7 * close + (1 - alpha7) * dsmaVal7[1] endif //---------------------------------------------------- // --- Calculate DSMA 8 --- if barindex>periods+7*step then currentPeriods = Periods + 7 * step s = 2 * pi / currentPeriods a1 = EXP(-g * pi / (0.5 * currentPeriods)) b1 = 2 * a1 * COS((g * s / (0.5 * currentPeriods)) * 180 / pi) c2 = b1 c3 = -a1 * a1 c1 = 1 - c2 - c3 zeros = close - close[2] filt8 = c1 * (zeros + zeros[1]) / 2 + c2 * filt8[1] + c3 * filt8[2] rms8 = SQRT(ExponentialAverage[currentPeriods](SQUARE(filt8))) IF rms8 <> 0 THEN scaledFilt8 = filt8 / rms8 ELSE scaledFilt8 = 0 ENDIF alpha8 = ABS(scaledFilt8) * 5 / currentPeriods IF alpha8 > 1 THEN // Clamp alpha alpha8 = 1 ENDIF dsmaVal8 = alpha8 * close + (1 - alpha8) * dsmaVal8[1] endif //---------------------------------------------------- // --- Calculate Average DSMA --- //---------------------------------------------------- ma = (dsmaVal1 + dsmaVal2 + dsmaVal3 + dsmaVal4 + dsmaVal5 + dsmaVal6 + dsmaVal7 + dsmaVal8) / 8 //---------------------------------------------------- // --- Calculate Score --- //---------------------------------------------------- score = 0 val = 0.14285714 // Approximately 1/7 IF dsmaVal1 > dsmaVal8 THEN score = score + val ENDIF IF dsmaVal2 > dsmaVal8 THEN score = score + val ENDIF IF dsmaVal3 > dsmaVal8 THEN score = score + val ENDIF IF dsmaVal4 > dsmaVal8 THEN score = score + val ENDIF IF dsmaVal5 > dsmaVal8 THEN score = score + val ENDIF IF dsmaVal6 > dsmaVal8 THEN score = score + val ENDIF IF dsmaVal7 > dsmaVal8 THEN score = score + val ENDIF // Ensure score is within 0-1 range (can slightly exceed due to float precision) IF score > 1 THEN score = 1 ELSIF score < 0 THEN score = 0 ENDIF // --- Determine Color based on Score (Manual Gradient) --- // If score > 0.5, gradient from transparent (at 0.5) to upperColor (at 1) // If score <= 0.5, gradient from downColor (at 0) to transparent (at 0.5) colorR = 0 colorG = 0 colorB = 0 alpha = 255 // Opacity IF score > 0.5 THEN // Scale score from 0 (at 0.5) to 1 (at 1.0) gradientFactor = (score - 0.5) * 2 colorR = Round(upperColorR * gradientFactor) colorG = Round(upperColorG * gradientFactor) colorB = Round(upperColorB * gradientFactor) alpha = Round(255 * gradientFactor) // Fade in ELSE // Scale score from 0 (at 0.0) to 1 (at 0.5) gradientFactor = score * 2 colorR = Round(downColorR * (1 - gradientFactor)) // Color fades out colorG = Round(downColorG * (1 - gradientFactor)) colorB = Round(downColorB * (1 - gradientFactor)) alpha = Round(255 * (1- gradientFactor)) // Fade out ENDIF // Clamp color values just in case IF colorR < 0 THEN colorR = 0 ELSIF colorR > 255 THEN colorR = 255 ENDIF IF colorG < 0 THEN colorG = 0 ELSIF colorG > 255 THEN colorG = 255 ENDIF IF colorB < 0 THEN colorB = 0 ELSIF colorB > 255 THEN colorB = 255 ENDIF IF alpha < 0 THEN alpha = 0 ELSIF alpha > 255 THEN alpha = 255 ENDIF // --- Detect Crossovers for Signal Generation --- crossUp = (score CROSSES OVER 0.3) crossDn = (score CROSSES UNDER 0.7) //---------------------------------------------------- // VISUALIZATION //---------------------------------------------------- // --- Plot Signals using Arrows --- IF crossUp THEN DRAWARROWUP(barindex, ma) COLOURED(upperColorR, upperColorG, upperColorB) ENDIF IF crossDn THEN DRAWARROWDOWN(barindex, ma) COLOURED(downColorR, downColorG, downColorB) ENDIF // --- Plot the score --- if islastbarupdate then upPercent=round(score*100,0) dnPercent=100-upPercent drawrectangle(-130,110,-137,110+upPercent)anchor(bottomright,xshift,yshift)fillcolor(upperColorR, upperColorG, upperColorB, alpha) drawtext("#upPercent#",-134,120+upPercent)anchor(bottomright,xshift,yshift) drawrectangle(-110,110,-117,110+dnPercent)anchor(bottomright,xshift,yshift)fillcolor(downColorR, downColorG, downColorB, alpha) drawtext("#dnPercent#",-114,120+dnPercent)anchor(bottomright,xshift,yshift) drawrectangle(-155,100,-100,max(120+dnPercent,120+uppercent)+20)anchor(bottomright,xshift,yshift) endif //---------------------------------------------------- RETURN ma COLOURED(colorR, colorG, colorB, alpha) AS "Multi DSMA Avg" STYLE(Line, 2) // Style 2 for slightly thicker line |
Share this
No information on this site is investment advice or a solicitation to buy or sell any financial instrument. Past performance is not indicative of future results. Trading may expose you to risk of loss greater than your deposits and is only suitable for experienced investors who have sufficient financial means to bear such risk.
ProRealTime ITF files and other attachments :
Find other exclusive trading pro-tools on ![]()
PRC is also on YouTube, subscribe to our channel for exclusive content and tutorials