MACD & RSI Overlay (Expo)

MACD & RSI Overlay (Expo)

█ Overview
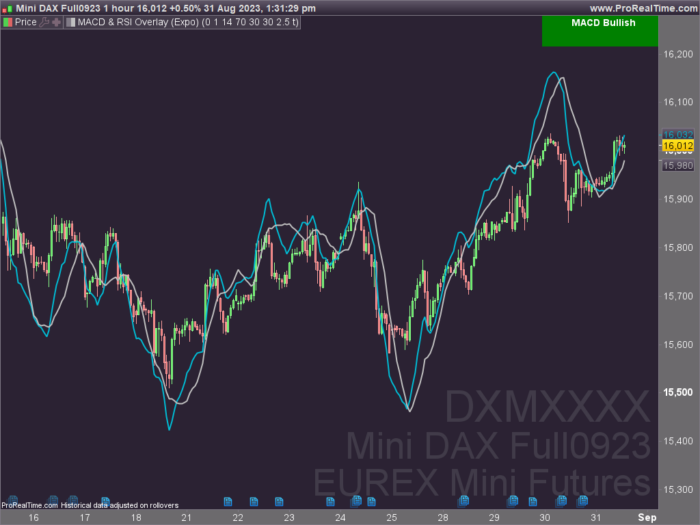
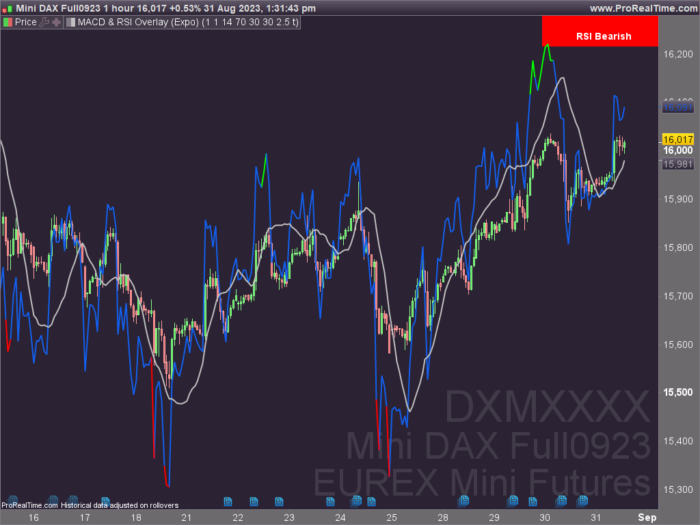
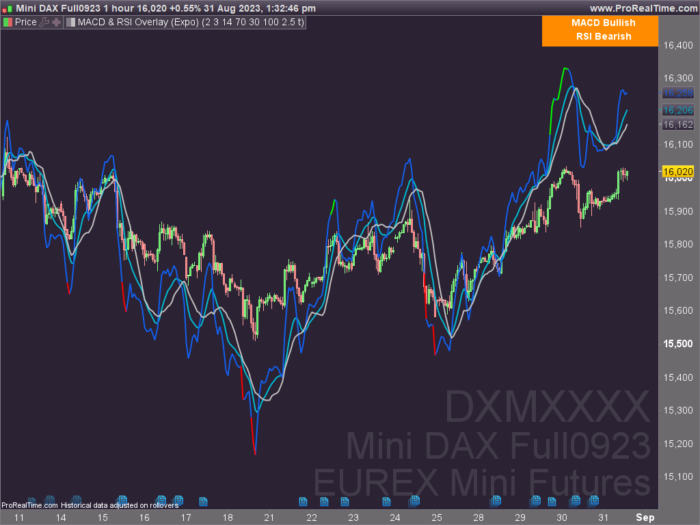
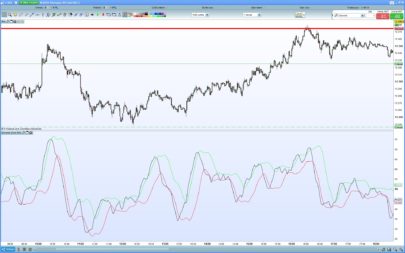
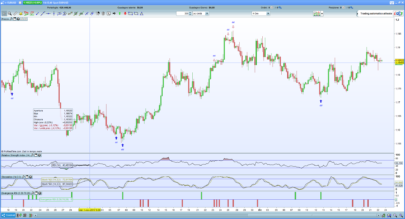
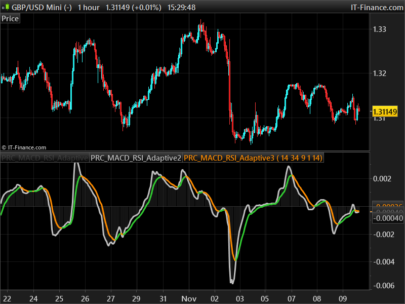
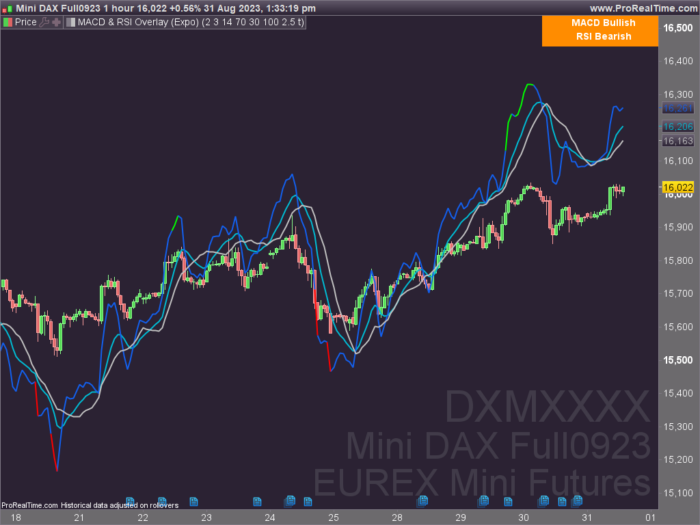
The MACD & RSI Overlay (Expo) trading indicator is a technical analysis tool that combines two popular indicators, the Relative Strength Index (RSI ) and the Moving Average Convergence Divergence (MACD ), and overlays them onto the price chart. The indicator oscillates relative to price, so it plots the RSI and MACD around price while still displaying the same insights as the regular MACD and RSI indicators. This feature gives traders a unique perspective, allowing them to see the relationship between price, momentum, and trend in a single chart.

This indicator is a valuable addition to any trader’s technical analysis toolkit, whether they are a beginner or an experienced trader.

█ MACD

█ RSI
The RSI comes with overbought and oversold areas, which can be set by the trader.

█ MACD & RSI

█ Trend Feature
What sets the MACD & RSI Overlay indicator apart is its ability to factor in the underlying trend. This feature makes the indicator more useful than ever before, as traders can use it to filter trades in the direction of the trend. By considering the underlying trend, traders can gain valuable insights into market trends.

..

█ Benefits
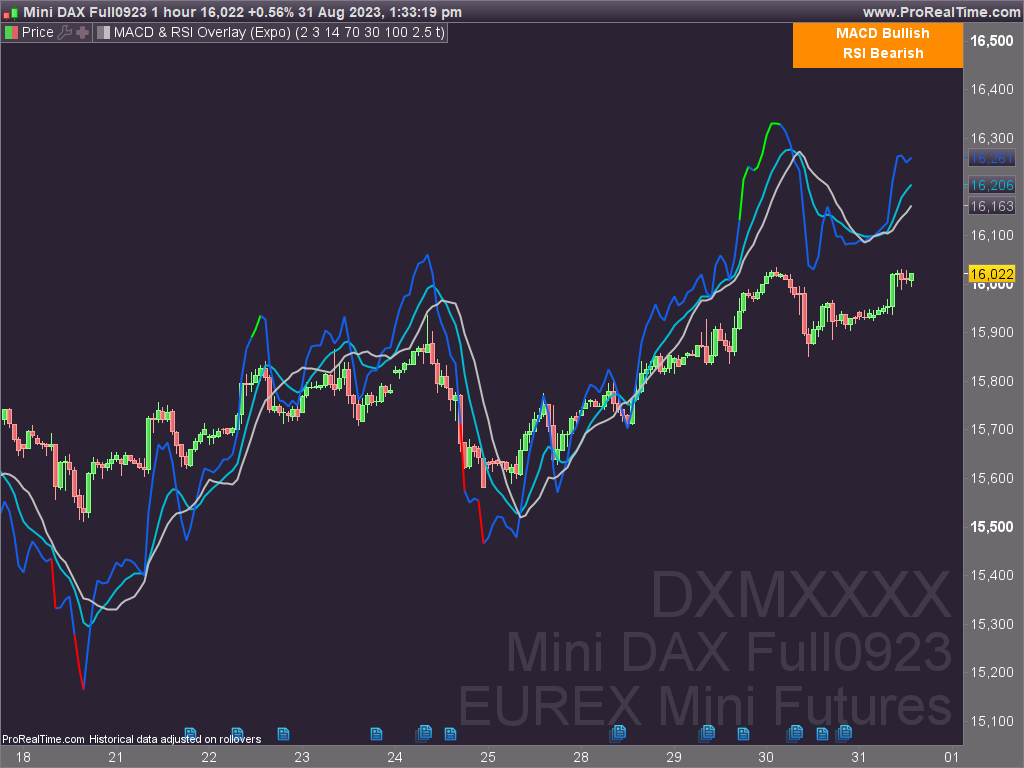
One of the primary benefits of having the MACD and RSI plotted directly on the price chart is that it provides a more intuitive understanding of the relationship between price, momentum, and trend. Traders can quickly identify the direction of the trend by observing the price movement relative to the MACD and RSI lines. In addition, by having these indicators plotted on the chart, traders can quickly identify potential buy and sell signals and develop new trading strategies.

█ How to use
One of the most popular strategies is to use the MACD & RSI Overlay indicator to look for crossings. A crossing occurs when the MACD and RSI lines cross over each other or when they cross over the signal line. These crossings can signal potential trend reversals and momentum shifts. For example, if the MACD line crosses over the signal line from below, it could indicate a bullish signal, while a cross from above could indicate a bearish signal.

—————–
Disclaimer

The information contained in my Scripts/Indicators/Ideas/Algos/Systems does not constitute financial advice or a solicitation to buy or sell any securities of any type. I will not accept liability for any loss or damage, including without limitation any loss of profit, which may arise directly or indirectly from the use of or reliance on such information.

All investments involve risk, and the past performance of a security, industry, sector, market, financial product, trading strategy, backtest, or individual’s trading does not guarantee future results or returns. Investors are fully responsible for any investment decisions they make. Such decisions should be based solely on an evaluation of their financial circumstances, investment objectives, risk tolerance, and liquidity needs.

My Scripts/Indicators/Ideas/Algos/Systems are only for educational purposes!

Share this

Risk disclosure:

No information on this site is investment advice or a solicitation to buy or sell any financial instrument. Past performance is not indicative of future results. Trading may expose you to risk of loss greater than your deposits and is only suitable for experienced investors who have sufficient financial means to bear such risk.

ProRealTime ITF files and other attachments : How to import ITF files into ProRealTime platform?

PRC is also on YouTube, subscribe to our channel for exclusive content and tutorials
  1. Matriciel • 08/31/2023 #

    Very nice job !
    Is it possible to do the opposite because what interests me is to have the price curve on a stochastic indicator.
    THANKS.
    Sincerely.

  2. YvesRobert • 08/31/2023 #

    Hi Matriciel, how can we do this, because stochastic is limited between 0 and 100 but price can be higher ? Thank you

  3. Traderfox06 • 08/31/2023 #

    Dear zeiiermantrading,
    I really like your approach combining adaptive averages with MACD in addition with fast RSI and scaling factors. This allows you to find very good entry points.
    However, I wonder, if you could help me to understand your ama, MACD and RSI calculation. It does not seem to be equal with the official formulas, e.g. like AMA = AdaptiveAverage[Period,FastPeriod,Slowperiod](close).
    Would you be so kind to share your ideas with your approach to calculate e.g. “imacd” or “pma”?
    Thanks in advance,
    Michael

avatar
Register or

Likes

avatar avatar avatar avatar avatar avatar avatar avatar avatar avatar avatar
Related users ' posts
Toto le Heros Thanks Nicolas. I read somewhere that in the calculation, we should round the value of the A...
Nicolas aADX = round(adx[10])
ak5hay2 Works like crazy on bitcoin. Use different timeframes. Thanks a lot Doc!!!
richyowen Hi, great code thanks. Very new to this forum. Is there a way to add a 100point target on an...
lisamitch50 Morning all, Just backtested on quite a few instruments, worked well on backtesting, but tel...
Matriciel
7 years ago
Alai-n Thanks...
Bard Thanks for sharing this Verdi55. More instructions from Larry Williams website (and a fea...
Nicolas
7 years ago
Jurik RSX
v10.3
Jurik RSX
3
Indicators
hartgeld Hallo Nicolas, ein sehr guter Indikator, vielen Dank! Leider rechnet er bei mir nicht die Pe...
rigel Hi Nicolas, have you coded the Jurik alone (as Mov. average)?
Nicolas 2 versions available in this indicator: https://www.prorealcode.com/prorealtime-indicators/a...
AG1 Thanks Nicolas Still a problem in line 29 Please take a look. thanks again Alex
Nicolas code is modified in the above post, use that one.
AG1 Still a problem in line 29 Please take a look. thanks again Alex
styrke Hello Nicolas, Nice screener, I appreciate the way you always try to condense at maximum th...
Nicolas There's no particular reason. RSI is widely use with its default period and results seems re...
DarioMazza Hi Vonasi, i have a question for you, the comand "pricetype" where did you found it in the ...
Vonasi PriceType is just a variable that I use. The value decides what type of price is used in the...
Vonasi I noticed a couple of typo errors in the code. The list of variables lines 4 to 11 should be...
MaoRai54 Hi, first of all Happy New Year. Well, I've inserted your indicator in DAX 1h but I cann...
Vinks_o_7 Hi Mao Happy New Year ! This is just an improved RSI where you plot a standard price momen...
Angel Perez Ciao Francesco. First of all thanks for the indicator and also fro the screener. I do have a...
PSIDIO Ciao to you all, I also have a question and would be very happy for a helpful comment. I a...
SpreadBetMH Hi there, I have V11.1. I get the Indicator but no Arrows on the price. Kind Regards...
Alai-n Ciao Francesco, sei ancora in giro?
Metodi97 This indicator is great but can someone create strategy based on the same indicator it will ...
Nicolas
7 years ago
TradeNavigator RSI
TradeNavigator RSI
10
Indicators
Nicolas Tutte le impostazioni che hanno la parola "period" sono quelle dedicate ai periodi di cambio...
GianfrancoCeck Le chiedo una ultima cosa, ossia se è possibile personalizzare l'indicatore con una scritta ...
Nicolas Spiacente che non sia possibile, le coordinate grafiche non sono in pixel ma nel prezzo e ne...
Nicolas Your picture is too small, but for sure the problem is about the fact you are still using v1...
Rory Dryden Thanks. This looks useful.
Edelmiro Un millón... de gracias... me gustaría más, poder ofrecer euros; pero va a ser que no puedo,...
Jessar Hello, could you tell me how to use this indicator? I think the simplest things can still be...
TACBOLSA
8 years ago
RB-MACD TIMING
RB-MACD TIMING
0
Screeners
Mirko Vaglio Interesting idea to bypass the limit of PRT about multiple timeframe, and I am just trying t...
Mirko Vaglio Looking a little bit more, now I understand what had to be absolutely obvious from the first...
Seb nice code! I'm trying to use your method to do a higher timeframe EMA, without success yet. ...
Francesco78 @snucke the results are not the same because the pictures refers to a few years ago. I am no...
snucke @Francesco78 i mean the results differ when i test on my own. so im curious of what the p...
sfl still working, using with filters like : trendFilterUp=close>average[190](close) tren...
Lydia1948 Hi I really like this indicator - is it easy to change the colour of the blue dots to say g...
Nicolas Lines 23 and 24 are the Red and Blue value between 0 to 255, you can change the color of the...
mahdi how can I import itf file into mt4? please help
Nicolas That code is not for MT4, we do not offer free assistance for this platform, but you can ask...
guinsu2000 hello could you share your copy in a pdf or where you whant please ?
alex Im looking for a entry when EpicMA crosses over/under trigger. Then look for exits when Epic...

Top