MACD & RSI Overlay (Expo)

MACD & RSI Overlay (Expo)

█ Overview
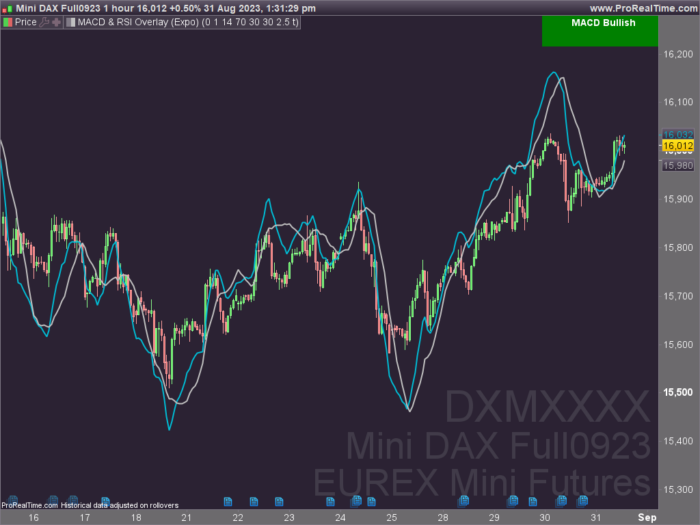
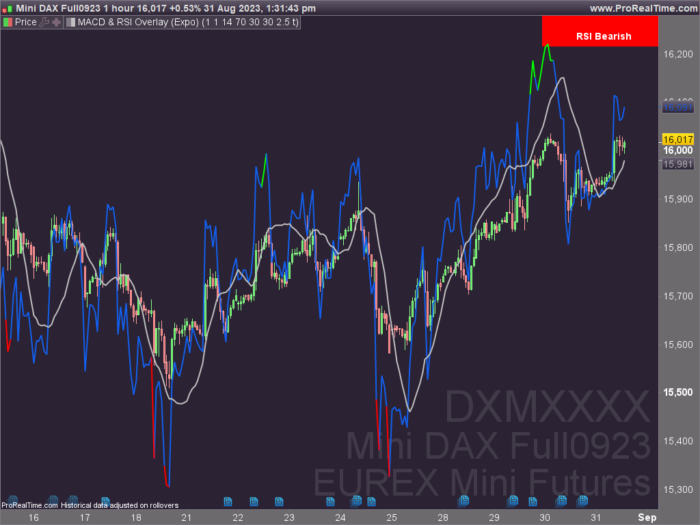
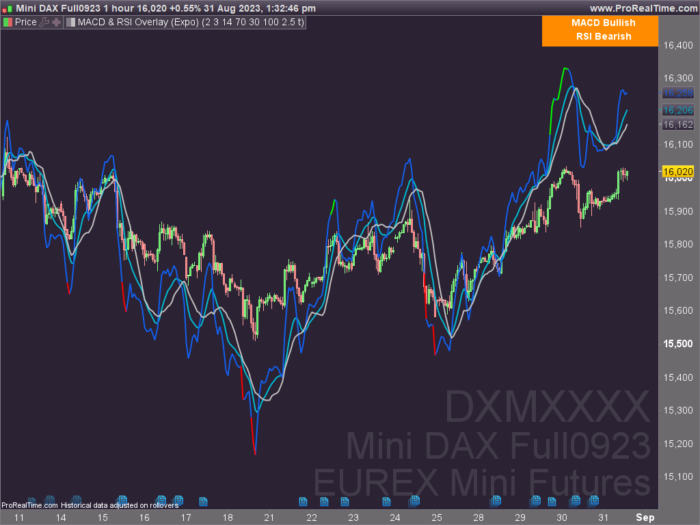
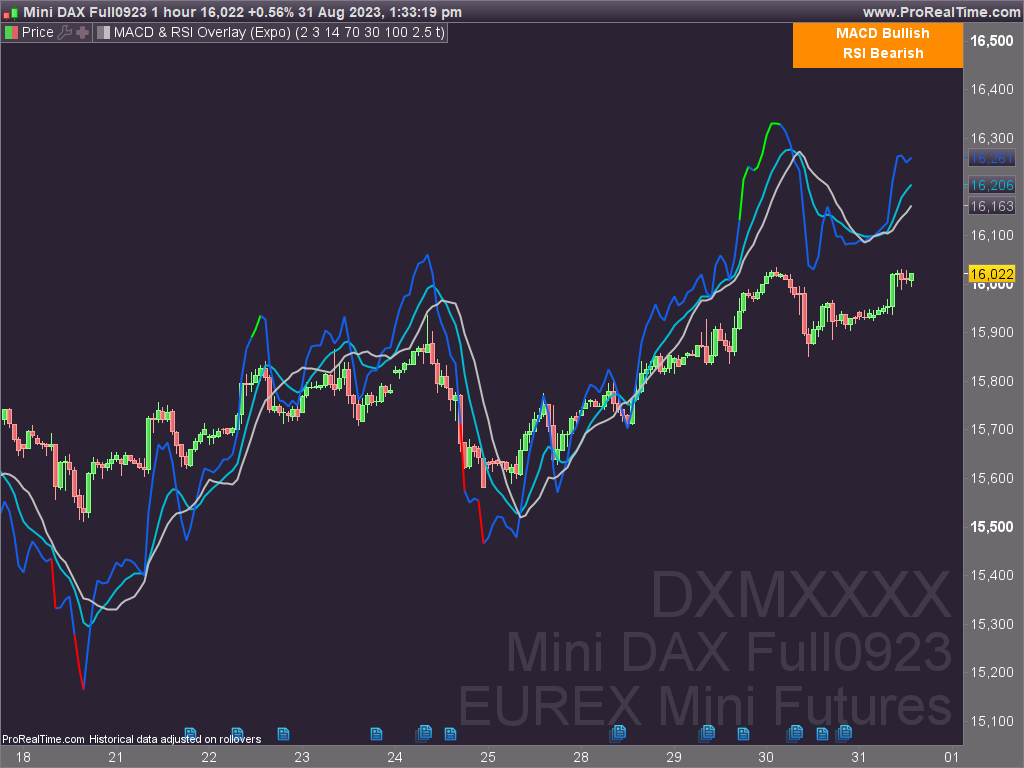
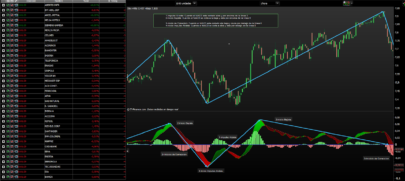
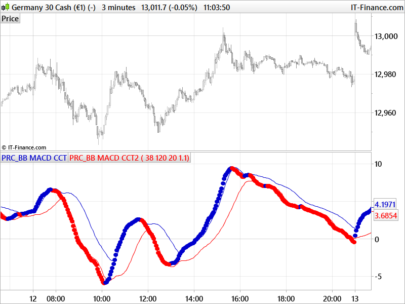
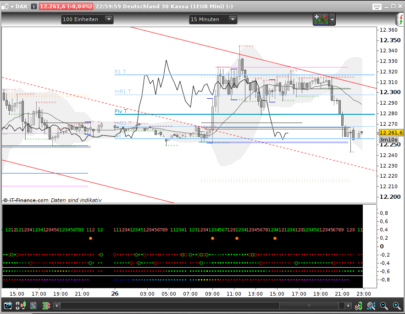
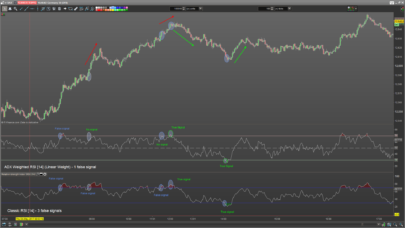
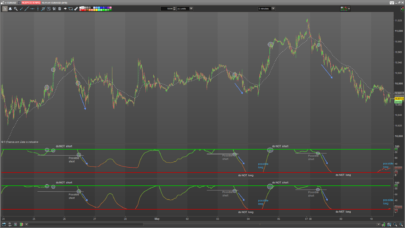
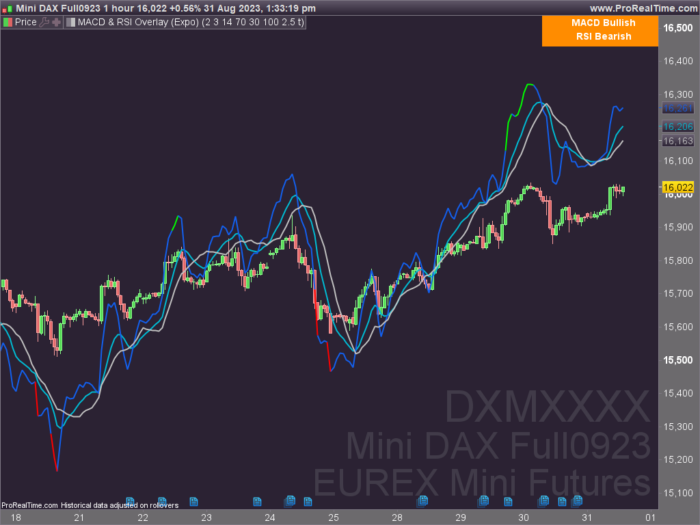
The MACD & RSI Overlay (Expo) trading indicator is a technical analysis tool that combines two popular indicators, the Relative Strength Index (RSI ) and the Moving Average Convergence Divergence (MACD ), and overlays them onto the price chart. The indicator oscillates relative to price, so it plots the RSI and MACD around price while still displaying the same insights as the regular MACD and RSI indicators. This feature gives traders a unique perspective, allowing them to see the relationship between price, momentum, and trend in a single chart.

This indicator is a valuable addition to any trader’s technical analysis toolkit, whether they are a beginner or an experienced trader.

█ MACD

█ RSI
The RSI comes with overbought and oversold areas, which can be set by the trader.

█ MACD & RSI

█ Trend Feature
What sets the MACD & RSI Overlay indicator apart is its ability to factor in the underlying trend. This feature makes the indicator more useful than ever before, as traders can use it to filter trades in the direction of the trend. By considering the underlying trend, traders can gain valuable insights into market trends.

..

█ Benefits
One of the primary benefits of having the MACD and RSI plotted directly on the price chart is that it provides a more intuitive understanding of the relationship between price, momentum, and trend. Traders can quickly identify the direction of the trend by observing the price movement relative to the MACD and RSI lines. In addition, by having these indicators plotted on the chart, traders can quickly identify potential buy and sell signals and develop new trading strategies.

█ How to use
One of the most popular strategies is to use the MACD & RSI Overlay indicator to look for crossings. A crossing occurs when the MACD and RSI lines cross over each other or when they cross over the signal line. These crossings can signal potential trend reversals and momentum shifts. For example, if the MACD line crosses over the signal line from below, it could indicate a bullish signal, while a cross from above could indicate a bearish signal.

—————–
Disclaimer

The information contained in my Scripts/Indicators/Ideas/Algos/Systems does not constitute financial advice or a solicitation to buy or sell any securities of any type. I will not accept liability for any loss or damage, including without limitation any loss of profit, which may arise directly or indirectly from the use of or reliance on such information.

All investments involve risk, and the past performance of a security, industry, sector, market, financial product, trading strategy, backtest, or individual’s trading does not guarantee future results or returns. Investors are fully responsible for any investment decisions they make. Such decisions should be based solely on an evaluation of their financial circumstances, investment objectives, risk tolerance, and liquidity needs.

My Scripts/Indicators/Ideas/Algos/Systems are only for educational purposes!

Share this

Risk disclosure:

No information on this site is investment advice or a solicitation to buy or sell any financial instrument. Past performance is not indicative of future results. Trading may expose you to risk of loss greater than your deposits and is only suitable for experienced investors who have sufficient financial means to bear such risk.

ProRealTime ITF files and other attachments : How to import ITF files into ProRealTime platform?

PRC is also on YouTube, subscribe to our channel for exclusive content and tutorials
  1. Matriciel • 08/31/2023 #

    Very nice job !
    Is it possible to do the opposite because what interests me is to have the price curve on a stochastic indicator.
    THANKS.
    Sincerely.

  2. YvesRobert • 08/31/2023 #

    Hi Matriciel, how can we do this, because stochastic is limited between 0 and 100 but price can be higher ? Thank you

  3. Traderfox06 • 08/31/2023 #

    Dear zeiiermantrading,
    I really like your approach combining adaptive averages with MACD in addition with fast RSI and scaling factors. This allows you to find very good entry points.
    However, I wonder, if you could help me to understand your ama, MACD and RSI calculation. It does not seem to be equal with the official formulas, e.g. like AMA = AdaptiveAverage[Period,FastPeriod,Slowperiod](close).
    Would you be so kind to share your ideas with your approach to calculate e.g. “imacd” or “pma”?
    Thanks in advance,
    Michael

avatar
Register or

Likes

avatar avatar avatar avatar avatar avatar avatar avatar avatar avatar avatar
Related users ' posts
rejo007 hello david, i'll try it could you tell me wich strategy do you use in real? thanks
David Somogyi Hello, I have a couple of DAX strategies of breakout and mean reversion. I'll try to post...
Roberto Blázquez Hi David, I just saw your strategy and it's good!!! I'm going to try it from today in real a...
Francesco
8 years ago
oraclus Merci il lui ressemble bcp
juanj Think this is something we can experiment with in the 'universal' strategy along with the Bo...
ggolfet Hello Francesco, thanks for the code. Now I can do backtests on this indicator. I'm testin...
juanj To follow new developments or get the latest version of this strategy please visit the forum...
tahar Hello Juan, I wanted to test Universal Strategy via a demo account on PRT but nothing happen...
BravoDelta @juanj wondering if you may help me please. I am looking for a simply strategy to use on the...
rispardin no entiendo como funciana este indicador, por favor alguien podria explicar como utilizarlo???
AVT No se trata de un solo indicador, pero cada linea muestra otra información, de abajo hacia ...
IV Mcm Your indicator is interesting, I evaluated its relevance with the squeeze to detect the phas...
Wilko I am not familiar with the screener function, but I am quite certain it should be quite simp...
Gubben @Wilko have you had a look at this again since MTF support? Heard you talk on Börssnack btw..
Wilko @Gubben not really. It was something I posted to show that simpler is usually better. Hope y...
Lotech123 Thanks for this indicator. Working on a 3 M timeframe with the DJI, it can produce some inte...
JSTAR PRODUCTIONS Hi there, I downloaded the Indicator but the indicator does not show up on my charts. Am...
JSTAR PRODUCTIONS Hi, Worked it out. Thanks
GraHal Yes sorry, I set up a link to a screen shot on my google drive and then I got locked into th...
gabri Here's the thread https://www.prorealcode.com/topic/multiframe-rsi-of-rsi/
Bernard13 Bonjour Nicolas, Pourriez-vous m'indiquer si cet indicateur fonctionne avec la V11 ? Le di...
nwesterhuijs Thanks, only saw it just now.
juanj For the latest version and discussions see the Ichimoku thread here: https://www.prorealcod...
Louwrens Hi Juanj. Thanks for this. I am tying it as we speak. It does not trade that often, which is...
ALE
8 years ago
CSR strategy DAX 1 D
17
Strategies
Jesper I tried it on dax 1D and I did not get any trades. Shifted to 10H and it started working. Wo...
rgrgrgr I have the same problem
avatar
crazytrader Is this working?
Maz
8 years ago
Francesco78 very nice, thanks!
Wilko Interesting! Thanks for sharing!
BjornH Extremely nice, thanks!
finplus Thanks for the job. Which variables do you suggest for timeframe 1 hour? 
Maz Depends massively on your market and the volatility. I suggest using the variable optimizer ...
1Randy This a great momentum filter! I would like to see volume momentum incorporated into the indi...
CavalierDeCesDames Bonjour Nicolas, Thanks for your use full job. I tried this indicator on a shorter timefram...
Nicolas You are welcome. I'm glad you like it.
Bolbo It does not appear over the price indicator on V11. Thanks in advance.
Nicolas All conditions under parenthesis for the c1 to c4 conditions should be inverted. 
tomus Can you give an example of the overbought codes please? Thanks.
ams123 Frank Merci Nicholas -:)
Djo Not working on V11. The RSI doesn't appear on the chart.
Mika83 Bonjour, J'ai des soucis de lecture de syntaxe avec la variable "drawsegment" sur la versio...
seb234 Salut Mika, j'ai la version V11.1, la formule fonctionne. Mais il est préférable, dixit Nico...
bolsatonimora2 Hi, nice indicator, it´s possible to include a middle line with 50 value? ty!
gabri Hi, EMA26 approximate almost exactly the 50% line
Alain Wilder MA is exactly the 50% line
Nicolas
8 years ago
Loop Hi All! Would it be possible to have the same indicator with the MACD calculated with the DE...
Nicolas Why not, but do you think it would make such a noticeable difference?
Loop Good question Nicolas! That's why I was curious to check it! MACD based on DEMA is usually m...
supertiti Thanks you so much Lucassen
dreif123 hi, copied the above code, not working on 10.3 the system says "return can only be used at ...
LUCASSEN Hallo , i have no problem , and i have the same versie 10.3, maybe you can ask Nicolas, tha...

Top