







MACD Impulse Elder divergences
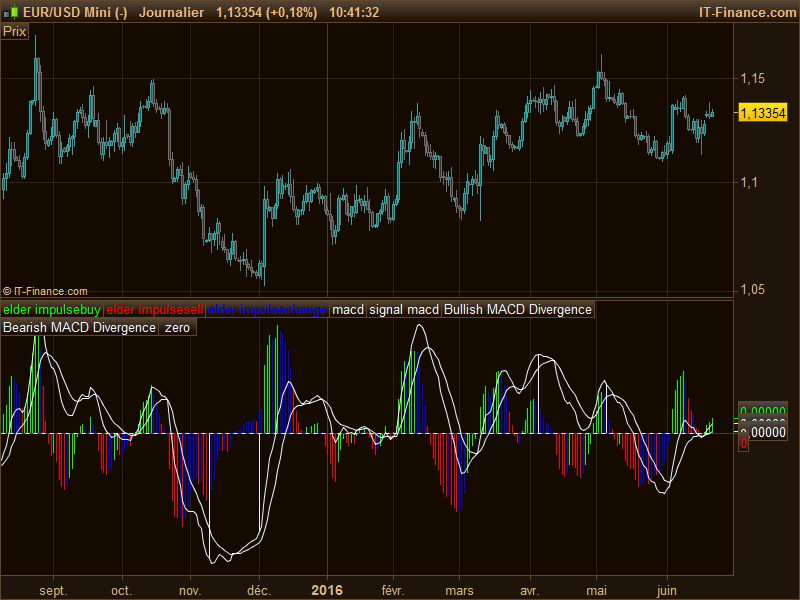
I use it exclusively for the DAX, and timeframes of 1 and 5 minutes, although I suppose in longer times also work.
About the MACD I do not think there’s much to explain. I do not use it as the sole indicator, of course, but it is a good complement to detect differences, and it also helps the automatic detector thereof. When the histogram rises, albeit negative, it’s time for long, but I repeat that it is not the indicator that entry. What is interesting are the bars with colors: according to the Elder Impulse System, if the bar is blue, is indifferent, although it may help seeing the previous trend. If the bar is red, it prohibits long and recommends short, and if the bar is green, prohibits short and long recommended. I hope to see two or three green candles in a row to go long or short red. The Elder Impulse System is a combination of momentum and trend. The ideal for long time is when the histogram rises, the candle is green just above zero and there is a divergence above. Ditto for short, but in reverse. Should confirm the differences visually. Naturally, the higher will be the histogram bars, the more the price goes up. If you are long and bar turns red, it is out.
I know it’s very simple, but as I practiced with this indicator (along with others), works for me.
MACD divergences are also spotted in this indicator (white histograms in the screenshot).
The first 3 variables must be rendered as histogram, along with the divergences variables too.
/////////////////MACD IMPULSE ELDER////
//  variables
// pc, fast ma, 12
// pl, slow ma, 26
// ps, signal, 9
// p, exp ma EIS, 18
// set first three and divergences as histograms
pc=12
pl=26
ps=9
p=13//periodos EIS
aa=exponentialaverage[p](close)
cc=MACD[pc,pl,ps](close)
if aa > aa[1]  and cc>cc[1] Then
dd =cc*2
else
dd=0
endif
if aa<aa[1] and cc < cc[1] then
ee=cc*2
else
ee=0
endif
if ( aa <aa[1] and cc > cc[1]) or (aa>aa[1] and cc<cc[1])  then
ff=cc*2
else
ff=0
endif
REM MACD
hh=exponentialaverage[pc](close) - exponentialaverage[pl](close)

REM Signal
hh1=exponentialaverage[ps](hh)

// DIVERGENCES ZeroLag MACD adapted from HK-LISSE RSI divergences code

EMAshort1 = exponentialaverage[pc](close)
EMAshort2 = exponentialaverage[pc](EMAshort1)
DifferenceShort = EMAshort1 - EMAshort2
ZeroLagShort = EMAshort1 + DifferenceShort

EMAlong1 = exponentialaverage[pl](close)
EMAlong2 = exponentialaverage[pl](EMAlong1)
DifferenceLong = EMAlong1 - EMAlong2
ZeroLagLong = EMAlong1 + DifferenceLong

ZeroLagMACD = ZeroLagShort - ZeroLagLong

signal1=ExponentialAverage[ps](ZEROLAGMACD)
signal2=ExponentialAverage[ps](signal1)
DIFFERENCE2=signal1-signal2

SignalMACD=signal1+DIFFERENCE2
x = ZeroLagMACD
y = SignalMACD

//  BEARISH DIVERGENCES MACD
hi=max(hi,x)
hico=max(hico,max(high,high[1]))

if x crosses under y then
sto2b=sto1b
sto1b=hi
hi=0
p3b=p1b
p2b=max(p1b,hico1)
p1b=max(highest[3](high),hico)
if p2b=p1b then
p2b=max(p3b,p4b)
endif
hico=0
hico1=0
endif
if x<y then
p4b=hico1
hico1=max(hico1,high)
endif
if p1b>p2b and sto1b<sto2b and x crosses under y and x<x[1] then
signB= hh//-2
else
signB= 0
endif

// BULLISH MACD DIVERGENCES
lo=min(lo,x)
lowco=min(lowco,min(low,low[1]))

if x CROSSES OVER y  then
sto2h=sto1h
sto1h=lo
lo=100
p3h=p1h
p2h=min(p1h,lowco1)
p1h=min(lowest[3](low),lowco)
if p2h=p1h then
p2h=min(p3h,p4h)
endif
lowco=100000
lowco1=100000
endif
if x>y then
p4h=lowco1
lowco1=min(lowco1,low)
endif
if p1h<p2h and sto1h > sto2h and x crosses over y and x>x[1]  then
signH= hh//2
else
signH= 0
endif

return dd*pipsize COLOURED(0,255,0) as "elder impulsebuy", ee*pipsize COLOURED(255,0,0) as "elder impulsesell", ff*pipsize coloured(0,0,255) as "elder impulsechange", hh*pipsize as "macd", hh1*pipsize as "signal macd", signH*pipsize as "Bullish MACD Divergence", signB*pipsize as "Bearish MACD Divergence" , 0 as " zero "
Comments
You must be logged in to post a comment.

Thanks a lot for the indicator. It is essential in my strategy.... And I have a request if someone can help me with the coding... For me it would be really helpful if the Histogram would change colors depending on the difference with the previous bar as well. I mean, if the histogram is blue and the next bar is still blue but with a lower value, then it would be colored in a lighter blue or if it has a higher value in a stronger blue. I don't know if it is possible.... Thanks in advance.

Thanks for the code, excellent work. I remember Elder suggesting to use this system on the second timeframe higher to the one you use for trading (i.e. if you trade on an hourly timeframe you should get this indicator running out of the weekly charts and use a force index indicator out of the daily one). Since PRT doesn't allow multi frames yet I suggest to keep the daily timeframe running (like you did) and change the settings as folllow by multiply the current settings by a factor of five:
pc=60 pl=130 ps=20 p=65

The graph you obtain represents very well a weekly macd and EMA13 on a daily frame.

Cheers

Gabriele


Hi Leofib, Did you finally find a screener following Elder MACD-H divergences? If so, could you please share with me? I appreciate your support!!
Thanks Petrus, However I think the problem is not with how fast they are but I suspect your code has been written considering the MACD Lag. I'll try to explain.
I noticed that your original code (which follows the Zerolag), signals a divergence as soon as the MACD H turns positive (or negative), i.e. when it corss the zero line.
By using the original MACD H, and following Elder's instruction, you have a divergence when the MACD H TICKS UP (or down) independently on being above or below the (normal) MACD H.
Thus, the problem could be that you have coded your indicator by giving a divergence signal when it crosses the zero line and not when it ticks up or down from a previous bar. I'm not able to verify this by reading your code but what you believe?
Thianks again!
Exactly leofib!! That's the reason for using the ZeroLag.
As in many other indicators, if you reduce the number of periods or if you want they faster, it becomes more nervous but they anticipate the information, although you have to pay the price of giving some fake signals. There is no other solution.
If you read the code, even the signal (in both, normal MACD and ZeroLag) are nothing but an exponential average over the MACD or ZeroLag: that means, they smoothed the nervous curve. ZeroLag, as the name tells, will be always faster than the normal MACD and will give signals that the normal MACD cannot see. However, I think that the difference between both are really not so critical.
Thnak you Petrus. I adapted your code as you suggested and noticed that by using the normal MACD it misses a great number of divergences which are on the other side correctly detected by the Zerolag MACD version, even if with a couple of bars laters.
In other words, the normal MACD H version is much less precise than the Zerolag Version. Could it be that it requires some other modification?
Thanks for your patience
Hi leofib.
To use the normal MACD for the divergences, you only have to change in line 54
x=hh (instead of ZeroLagMACD)-> this is the normal MACD of line 30
and in line 55
y=hh1 (instead of SignalMACD)-> this is the normal Signal of line 33
After that, you have only to eliminate (or write REM or // on the start of the lines) the lines 35 to 53.
That's all. And I have tested it and it works.
Hi Petrus, yes I noticed it sometimes misses a major divergence but I would say it takes about 90% of the MACD H divergences, but a couple of bar later than the same divergence signaled by the plain MACD. It has to be followed "by hand" of course but it would be of great help having this scanner working with the plain MACD just to let it do the gross job. I wonder if you can help with this as I am not good at all in coding. Thanks!
Hi leofib.
As I explained on the text, I did not code this scanner, I only adapted it from the first link, who also adapted it from a code of HK-LISSE (3rd link). But be careful: the divergence indicator works ok, but not on the 100% of the cases. They have to be confirmed visually, on the graph. It should be only used as a warning. And of course, even if the divergence are confirmed, not always are they giving the right information. You can sometimes get a clear bullish divergence, having in the near time a big bullish trend.
Hi Petrus and thanks for reply. I was indeed talking about the divergence scanner which, as you coded it, it uses the Lagged MACD instead of the plain MACD which is the one used by the divergence scanner coded by Elder for Tradestation.
I already use the Impulse system combined in the Triple Screen for my trading but was looking for a PRT version of the MACD divergence scanner to look for potential/running divergences and that's why I asked you.
Thanks again
The curves MACD and signal, and the MACD histogram are calculated using the normal MACD (lines 13, 30 and 33 of the code) , not the Zero Lag. The Zero Lag is used only used to calculate the divergences. But the most useful indication of this indicator is the normal MACD combinated with the Elder Impulse system.
If you want more information about the divergences, you can see following links:
http://www.prorealcode.com/prorealtime-indicators/divergences-rsx/
http://www.prorealcode.com/prorealtime-indicators/macd-divergences-from-price/
http://hk-lisse.over-blog.com/search/divergences%20macd/




le variabili poi le ho capite ad una più attenta rilettura, scusami, ma il grafico mi viene tutto diverso. Non ci sono le barre colorate verticali, solo tante curve oscillanti.
Non ho la tua mail, dove la trovo? Grazie. Scrivi a pieropadova@gmail.com.
Ciao Capitan Nemo.
I would not change these 4 variables, as they are the standard ones for the normal MACD (pc, pl, and ps) and for the Elder Impulse System (p).
But if you really want to change them and play with other values, you have to delete the lines 8 to 11, and put these 4 values in the indicator as variables (Add on the programming window), and then you can put there any value you want.
I also don't know how to include a photo of the graphic in this comment, but if you send me your mail, I will send you these possibilities.

l'indicatore che mi viene fuori senza modificare il codice è diverso dall'immagine che vedo ed è sicuramente sbagliato. Non so come gestire le 4 variabili iniziali messe con //. Cioè pc, pl, ps, p. Come devo usarle nel codice? Putroppo non riesco neanche a mandarvi uno screenshot del mio grafico perché il sistema mi dice che non sono autorizzato a farlo. Attendo qualche suggerimento. Grazie.
Capitan Nemo

Hi Petrus thank you so much for your indicator, very helpful.