1. Introduction
In the world of technical analysis, understanding where liquidity clusters can offer a powerful edge. These zones, often located around swing highs and lows, reveal areas where price has previously reacted strongly—either through rejection or breakthrough. The Liquidity Swings indicator (by LuxAlgo) is designed to visualize these key price zones, highlighting areas of potential support and resistance based on historical pivot points and volume interaction.
2. How the Indicator Works
The Liquidity Swings indicator identifies pivot highs and pivot lows based on a configurable lookback period. Once these pivot points are detected, the script begins to monitor how price interacts with those levels:
-
Touches: When price enters the defined liquidity zone but does not break through.
-
Crosses: When price decisively breaks beyond the liquidity zone.
For each pivot, the indicator keeps track of:
-
The number of touches.
-
The volume during these touches.
-
Whether the zone was eventually broken.
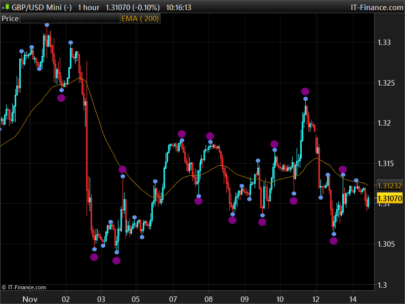
Once a zone is broken or has received enough interactions (touches), it is visualized on the chart with dynamic segments and rectangles to highlight the area.
This dual-layered logic allows traders to differentiate between respected zones (untouched) and weakened or broken zones (crossed).
3. Indicator Parameters
The indicator offers several parameters that allow for full customization:
-
length(default:14)
The number of bars used to identify pivot highs/lows. Higher values make the indicator detect more significant, less frequent pivots. -
areaType(default:1)
Defines how the liquidity zone is drawn:-
1: Wick extremities (from high to candle body). -
2: Full range (from high to low).
-
-
filterValue(default:2)
Minimum number of touches required for a zone to be displayed.
Display Settings
-
showTop(default:1)
Enable or disable resistance zones (pivot highs). -
topAreaAlpha(default:30)
Transparency level for the red resistance area (0–255). -
showBtm(default:1)
Enable or disable support zones (pivot lows). -
btmAreaAlpha(default:30)
Transparency level for the green support area (0–255).
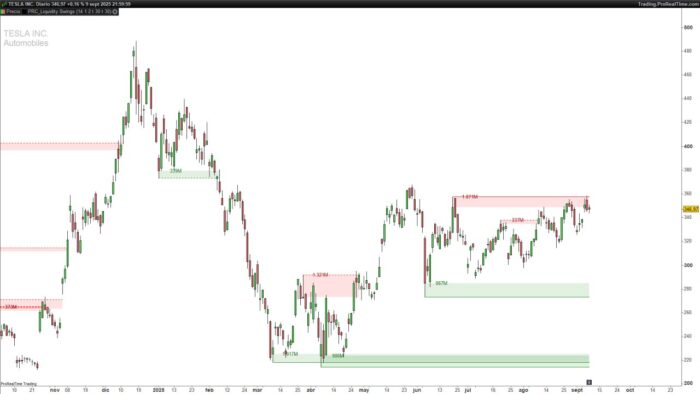
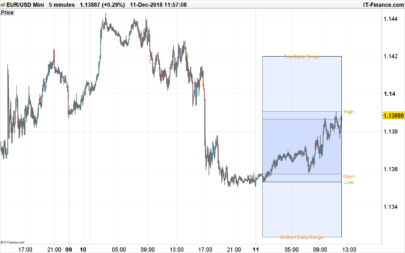
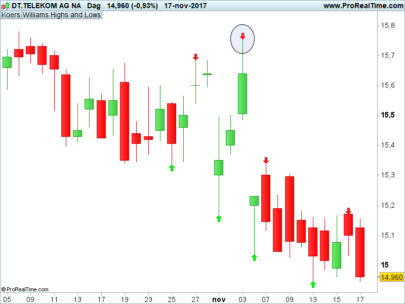
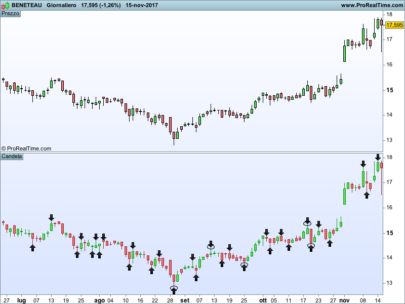
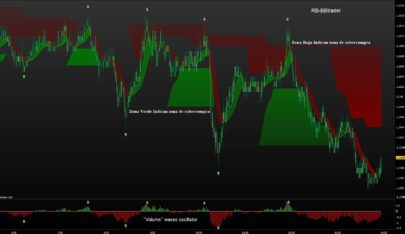
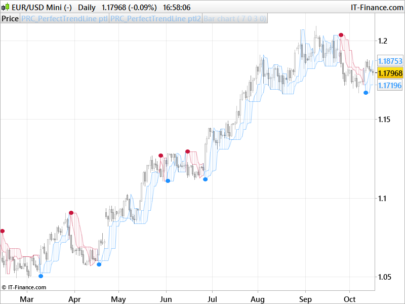
4. Chart Interpretation
Once applied, the indicator highlights liquidity zones using a color-coded system:
-
Resistance Zones (Pivot Highs):
-
Red dotted line: broken liquidity level.
-
Red rectangle: area from top wick to body or full range.
-
Label above the zone shows total volume accumulated from touches.
-
-
Support Zones (Pivot Lows):
-
Green dotted line: broken liquidity level.
-
Green rectangle: support area.
-
Label below the zone shows volume data.
-
If the zone hasn’t been broken but has sufficient touch count, the indicator draws the segment until the current bar, allowing traders to assess ongoing respect for the zone.
This allows for intuitive visualization of both historical significance and current relevance of price zones.
5. Configuration Tips
-
Increase
filterValueto 3 or more to reduce noise and focus on high-importance zones. -
If you’re only interested in resistance, disable
showBtm, and vice versa. -
Adjust
topAreaAlphaandbtmAreaAlphafor better integration with your chart’s background.
6. ProRealTime Code
|
1 2 3 4 5 6 7 8 9 10 11 12 13 14 15 16 17 18 19 20 21 22 23 24 25 26 27 28 29 30 31 32 33 34 35 36 37 38 39 40 41 42 43 44 45 46 47 48 49 50 51 52 53 54 55 56 57 58 59 60 61 62 63 64 65 66 67 68 69 70 71 72 73 74 75 76 77 78 79 80 81 82 83 84 85 86 87 88 89 90 91 92 93 94 95 96 97 98 99 100 101 102 103 104 105 106 107 108 109 110 111 112 113 114 115 116 117 118 119 120 121 122 123 124 125 |
//-----------------------------------------// //PRC_Liquidity Swings by LuxAlgo //version = 0 //05.09.2025 //Iván González @ www.prorealcode.com //Sharing ProRealTime knowledge //-----------------------------------------// defparam drawonlastbaronly=true //-----------------------------------------// // --- Parámetros de Configuración --- //-----------------------------------------// length = 14 // Pivot Lookback areaType = 1 // Swing Area: 1 = Wick Extremity, 2 = Full Range filterValue = 2 // Mostrar solo zonas con un conteo/volumen mayor a este valor //// --- Estilos --- showTop = 1 topAreaAlpha = 30 //0 - 255 showBtm = 1 btmAreaAlpha = 30 //0 - 255 //-----------------------------------------// // --- Inicialización de Arrays --- //-----------------------------------------// ONCE phCount = 0 ONCE plCount = 0 //-----------------------------------------// // --- FASE 1: Creacion de Arrays //-----------------------------------------// isPivotHigh = (high[length] = HIGHEST[2*length+1](high)) isPivotLow = (low[length] = LOWEST[2*length+1](low)) // Almacenar nuevo Pivote Alto IF isPivotHigh THEN $phTop[phCount] = high[length] IF areaType = 1 THEN $phBtm[phCount] = MAX(close[length], open[length]) ELSE $phBtm[phCount] = low[length] ENDIF $phLeft[phCount] = barindex[length] $phRight[phCount] = barindex[length-1] $phCrossed[phCount] = 0 $phTouchCount[phCount] = 0 $phTouchVolume[phCount] = 0 phCount = phCount + 1 ENDIF // Almacenar nuevo Pivote Bajo IF isPivotLow THEN $plBtm[plCount] = low[length] IF areaType = 1 THEN $plTop[plCount] = MIN(close[length], open[length]) ELSE $plTop[plCount] = high[length] ENDIF $plLeft[plCount] = barindex[length] $plRight[plCount] = barindex[length-1] $plCrossed[plCount] = 0 $plTouchCount[plCount] = 0 $plTouchVolume[plCount] = 0 plCount = plCount + 1 ENDIF //-----------------------------------------// // --- FASE 2: Dibujo //-----------------------------------------// IF islastbarupdate THEN // Procesar Zonas de Resistencia if showTop then FOR i = 0 TO phCount-1 DO dist=barindex-$phLeft[i] // Localizar el punto de ruptura for j=dist downto 1 do if $phCrossed[i] = 0 and close[j] > $phTop[i] then $phCrossed[i] = 1 $phRight[i] = barindex[j] break elsif $phCrossed[i] = 0 and high[j] > $phBtm[i] and low[j]<$phTop[i] then $phTouchCount[i] = $phTouchCount[i]+1 $phTouchVolume[i] = $phTouchVolume[i]+volume[j] endif next //Dibujar el nivel de liquidez vol=$phTouchVolume[i] if $phCrossed[i]=1 and $phTouchCount[i]>filterValue then drawsegment($phLeft[i],$phTop[i],$phRight[i],$phTop[i])style(dottedline)coloured("red") drawrectangle($phLeft[i],$phTop[i],$phRight[i],$phBtm[i])coloured("red",0)fillcolor("red",topAreaAlpha) drawtext("#vol#",$phLeft[i]+7,$phTop[i])coloured("darkred") elsif $phCrossed[i]=0 and $phTouchCount[i]>filterValue then drawsegment($phLeft[i],$phTop[i],barindex,$phTop[i])style(line)coloured("red") drawrectangle($phLeft[i],$phTop[i],barindex,$phBtm[i])coloured("red",0)fillcolor("red",topAreaAlpha) drawtext("#vol#",$phLeft[i]+7,$phTop[i])coloured("darkred") endif NEXT endif //-----------------------------------------// // Procesar Zonas de Soporte if showBtm then FOR i = 0 TO plCount - 1 DO dist2=barindex-$plLeft[i] // Localizar el punto de ruptura for j=dist2 downto 1 do if $plCrossed[i] = 0 and close[j] < $plBtm[i] then $plCrossed[i] = 1 $plRight[i] = barindex[j] break elsif $plCrossed[i] = 0 and low[j]<$plTop[i] and high[j]>$plBtm[i] then $plTouchCount[i] = $plTouchCount[i]+1 $plTouchVolume[i] = $plTouchVolume[i]+volume[j] endif next //Dibujar el nivel de liquidez vol2=$plTouchVolume[i] if $plCrossed[i]=1 and $plTouchCount[i]>filterValue then drawsegment($plLeft[i],$plBtm[i],$plRight[i],$plBtm[i])style(dottedline)coloured("green") drawrectangle($plLeft[i],$plBtm[i],$plRight[i],$plTop[i])coloured("green",0)fillcolor("green",btmAreaAlpha) drawtext("#vol2#",$plLeft[i]+7,$plTop[i])coloured("darkgreen") elsif $plTouchCount[i]>filterValue then drawsegment($plLeft[i],$plBtm[i],barindex,$plBtm[i])style(line)coloured("green") drawrectangle($plLeft[i],$plBtm[i],barindex,$plTop[i])coloured("green",0)fillcolor("green",btmAreaAlpha) drawtext("#vol2#",$plLeft[i]+7,$plTop[i])coloured("darkgreen") endif NEXT endif ENDIF //-----------------------------------------// RETURN |
7. Conclusion
The Liquidity Swings indicator offers a visually intuitive and algorithmically robust way to detect and analyze areas of significant price interaction. By combining pivot structure with touch count and volume filtering, it enables traders to better anticipate where the market is likely to find support or resistance.
Whether used standalone or in combination with other tools, this indicator can become an essential part of your technical analysis workflow.
Share this
No information on this site is investment advice or a solicitation to buy or sell any financial instrument. Past performance is not indicative of future results. Trading may expose you to risk of loss greater than your deposits and is only suitable for experienced investors who have sufficient financial means to bear such risk.
ProRealTime ITF files and other attachments :
Find other exclusive trading pro-tools on ![]()
PRC is also on YouTube, subscribe to our channel for exclusive content and tutorials


Hi Ivan, this indicator is great!!! Thank you so much! Do you think it is usable to create a bot starting from this indicator? Where do you see the trigger to open/close the trade? Thank you! Franco
Hello, thank you. Yes, it could be used, although I see it more for identifying reversal zones, using as a trigger an oscillator-type indicator and/or a specific candlestick pattern. It could also be interesting for breakout movements.
Thank you so much Ivan! Which oscillator-type indicator do you suggets? Morover do you suggest differet timeframe ( like for example 15 min for zone identification and 2 minutes for oscillator/candlestick pattern) or it is better not? Grazie Franco
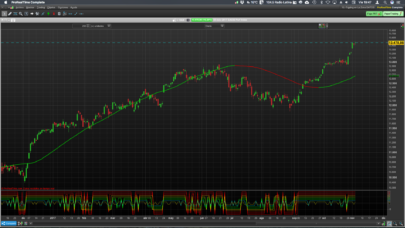
For example using TF 3 minutes, stocastico 3 min and 15 min, Dual Volume Divergence Indicator coming from this library, your Liquidity Swing Indicator, My 0725 Hull 30 Pull Back DistV1 ( that misure how wide is the swing, if it is green price is falling under a limit and in this case SELL are forbidden and must serach a BUY).. but I still having some false entry signal before 2100 of yesterday, please see image in attach
https://drive.google.com/file/d/1lSmW7lDUw8jzpLMCVC2NXDqO9QBFaxhS/view?usp=sharing
Merci Ivan, super indicateur. Question: comment modifier la transparence des rectangles?
Hi Ivan sorry another question, in order to create a bot that open the trade, I’m tryng to create an indicator starting from your to have the entry trigger. Unfortunatelly I have difficoult to understand if the current price is on the support or on a resistance.. I post my modification,please could you check whta is wrong?
////////////////////////////////////////// 0825-liquidity-test
//—————————————–//
//0925_Ivan_Liquidity Swings
//version = 0
//05.09.2025
//Iván González @ http://www.prorealcode.com
//Sharing ProRealTime knowledge
//—————————————–//
///defparam drawonlastbaronly=true
//—————————————–//
// — Parámetros de Configuración —
//—————————————–//
length = 14 // Pivot Lookback
areaType = 1 // Swing Area: 1 = Wick Extremity, 2 = Full Range
filterValue = 2 // Mostrar solo zonas con un conteo/volumen mayor a este valor
//// — Estilos —
showTop = 1
topAreaAlpha = 30 //0 – 255
showBtm = 1
btmAreaAlpha = 30 //0 – 255
//—————————————–//
// — Inicialización de Arrays —
//—————————————–//
ONCE phCount = 0
ONCE plCount = 0
//—————————————–//
// — FASE 1: Creacion de Arrays
//—————————————–//
isPivotHigh = (high[length] = HIGHEST[2*length+1](high))
isPivotLow = (low[length] = LOWEST[2*length+1](low))
// Almacenar nuevo Pivote Alto
IF isPivotHigh THEN
$phTop[phCount] = high[length]
IF areaType = 1 THEN
$phBtm[phCount] = MAX(close[length], open[length])
ELSE
$phBtm[phCount] = low[length]
ENDIF
$phLeft[phCount] = barindex[length]
$phRight[phCount] = barindex[length-1]
$phCrossed[phCount] = 0
$phTouchCount[phCount] = 0
$phTouchVolume[phCount] = 0
phCount = phCount + 1
ENDIF
// Almacenar nuevo Pivote Bajo
IF isPivotLow THEN
$plBtm[plCount] = low[length]
IF areaType = 1 THEN
$plTop[plCount] = MIN(close[length], open[length])
ELSE
$plTop[plCount] = high[length]
ENDIF
$plLeft[plCount] = barindex[length]
$plRight[plCount] = barindex[length-1]
$plCrossed[plCount] = 0
$plTouchCount[plCount] = 0
$plTouchVolume[plCount] = 0
plCount = plCount + 1
ENDIF
//—————————————–//
// — FASE 2: Dibujo
//—————————————–//
//IF islastbarupdate THEN
// Procesar Zonas de Resistencia
SonoSuResistenza=0
if showTop then
FOR i = 0 TO phCount-1 DO
dist=barindex-$phLeft[i]
// Localizar el punto de ruptura
for j=dist downto 1 do
if $phCrossed[i] = 0 and close[j] > $phTop[i] then
$phCrossed[i] = 1
$phRight[i] = barindex[j]
break
elsif $phCrossed[i] = 0 and high[j] > $phBtm[i] and low[j]filterValue then
///drawsegment($phLeft[i],$phTop[i],$phRight[i],$phTop[i])style(dottedline)coloured(“red”)
//drawrectangle($phLeft[i],$phTop[i],$phRight[i],$phBtm[i])coloured(“red”,0)fillcolor(“red”,topAreaAlpha)
//drawtext(“#vol#”,$phLeft[i]+7,$phTop[i])coloured(“red”)
elsif $phCrossed[i]=0 and $phTouchCount[i]>filterValue then
//drawsegment($phLeft[i],$phTop[i],barindex,$phTop[i])style(line)coloured(“red”)
//drawrectangle($phLeft[i],$phTop[i],barindex,$phBtm[i])coloured(“red”,0)fillcolor(“red”,topAreaAlpha)
//drawtext(“#vol#”,$phLeft[i]+7,$phTop[i])coloured(“red”)
if high>$plTop[i] and close<$plTop[i] and open<$plTop[i] then
SonoSuResistenza=1
endif
endif
NEXT
endif
//—————————————–//
// Procesar Zonas de Soporte
SonoSuSupporto=0
if showBtm then
FOR i = 0 TO plCount – 1 DO
dist2=barindex-$plLeft[i]
// Localizar el punto de ruptura
for j=dist2 downto 1 do
if $plCrossed[i] = 0 and close[j] < $plBtm[i] then
$plCrossed[i] = 1
$plRight[i] = barindex[j]
break
elsif $plCrossed[i] = 0 and low[j]$plBtm[i] then
$plTouchCount[i] = $plTouchCount[i]+1
$plTouchVolume[i] = $plTouchVolume[i]+volume[j]
endif
next
//Dibujar el nivel de liquidez
vol2=$plTouchVolume[i]
if $plCrossed[i]=1 and $plTouchCount[i]>filterValue then
//drawsegment($plLeft[i],$plBtm[i],$plRight[i],$plBtm[i])style(dottedline)coloured(“green”)
//drawrectangle($plLeft[i],$plBtm[i],$plRight[i],$plTop[i])coloured(“green”,0)fillcolor(“green”,btmAreaAlpha)
//drawtext(“#vol2#”,$plLeft[i]+7,$plTop[i])coloured(“darkgreen”)
if open>$plBtm[i] and close>$plBtm[i] and lowfilterValue then
//drawsegment($plLeft[i],$plBtm[i],barindex,$plBtm[i])style(line)coloured(“green”)
//drawrectangle($plLeft[i],$plBtm[i],barindex,$plTop[i])coloured(“green”,0)fillcolor(“green”,btmAreaAlpha)
//drawtext(“#vol2#”,$plLeft[i]+7,$plTop[i])coloured(“darkgreen”)
//drawtext(“#vol2#”,barindex,close)coloured(“blue”)
if open>$plBtm[i] and close>$plBtm[i] and low<$plTop[i] then
SonoSuSupporto=1
endif
endif
NEXT
endif
///ENDIF
if SonoSuResistenza=1 THEN
//DRAWARROWDOWN(barindex, high+10) COLOURED(0,0,0)
endif
if SonoSuSupporto=1 THEN
//DRAWARROWUP(barindex, low-10) COLOURED(0,0,0)
endif
//—————————————–//
RETURN SonoSuSupporto as "SonoSuSupporto"
Hello Ivan, I tested the indicator, which is great, but I only get the volume display for Bitcoin or gold, not for currency pairs. Why? I’m with IB.
Thanks in advance.
Freddy