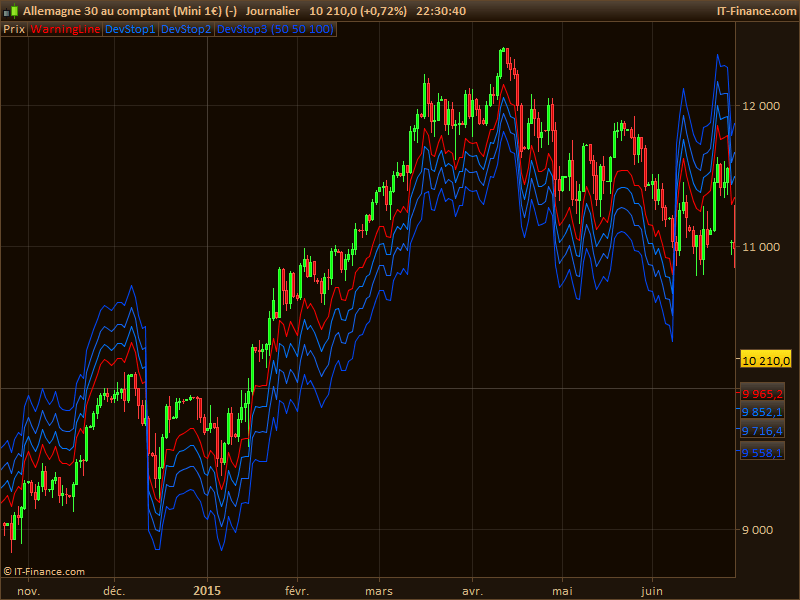
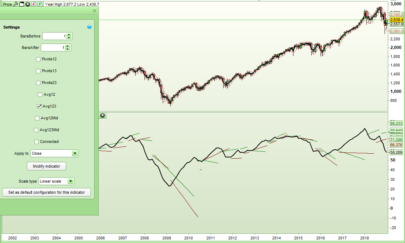
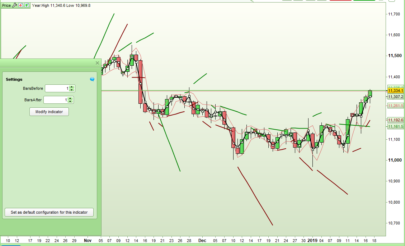
This is the indicator describe by
Here is the Prorealtime code :
|
1 2 3 4 5 6 7 8 9 10 11 12 13 14 15 16 17 18 19 20 21 22 23 24 25 26 |
//pararemeters: //n = 20 //periodFast = 5 //periodSlow = 21 DTR = max(max(High - Low[2], abs(High - Close[2])),max(abs(Low - Close[2]),(abs(Low - Close[2])))) price = typicalprice avg = average[n](DTR) st = std[n](DTR) maFast = average[periodFast](close) maSlow = average[periodSlow](close) if maFast<maSlow then WarningLine = price+avg Dev1 = price+avg + st Dev2 = price+avg + 2.2*st Dev3 = price+avg + 3.6*st else WarningLine = price-avg Dev1 = price-avg - st Dev2 = price-avg - 2.2*st Dev3 = price-avg - 3.6*st endif RETURN Warningline coloured(255,0,0) as "WarningLine", Dev1 coloured(2, 118, 253) as "DevStop1", Dev2 coloured(20, 100, 244) as "DevStop2", Dev3 coloured(1, 71, 250) as "DevStop3" |
Share this
No information on this site is investment advice or a solicitation to buy or sell any financial instrument. Past performance is not indicative of future results. Trading may expose you to risk of loss greater than your deposits and is only suitable for experienced investors who have sufficient financial means to bear such risk.
ProRealTime ITF files and other attachments :
Find other exclusive trading pro-tools on ![]()
PRC is also on YouTube, subscribe to our channel for exclusive content and tutorials


Hi Nicolas – I have found Kase’s research white paper on this Dev Stop. The Stop switches from Long to Short based upon a 10 and 21 day Moving Average. This is why the “Warning Line” and Dev 1, Dev 2 and Dev 3, don’t switch sides to be above or below the market prices. I’m not sure what kind maybe a simple mov ave, but a zero lag would probably be more responsive. (I also wonder what would happen if a displaced Mov Ave was used horizontally shifted 2 periods in advance of price (-2)?) http://www.kaseco.com/support/whitepapers/Kase%20StatWare.pdfThe calculation for one of the three Dev Stops is:Page 2:The value of the stop amount is calculated as follows.DTR (double true range) = @max((H – L[2]), abs(H – C[2]), abs(L – C[2])) — not so sure you’ll need the @ symbol (-:StopAmount = average(DTR, n) + stddev(DTR, n)Notice the stop uses a double true range, which I found after extensive research to work better thanthe single. For the actual stops, I use a default of 30 for n, and calculate the average (0), 1, 2.2 and3.6 standard deviations over the mean. The reason why I add 10% to the two standard deviationlevel and 20% to the three standard deviation level is to account for skew.Pictures showing the Warning Line and Dev 1, Dev 2 and Dev 3 are in the link above as I can’t add them here.p.s. I got really odd behaviour when clicking the “add link” above — this whole page keeps jumping down to the bottom where it says “next” in the blue section below called “related users posts”?Now I can’t add images either as I have done in the past as there is no attachments/browse tab? (Firefox and Macbook Pro)
Any chance of getting this Kase Dev Stop fixed and able to alternate with a 5 and 21 day moving average? At the moment it’s unidirectional? The last variation on this Dev Stop byCynthia Kase can be found on the Elite Traders site if ” Kase Dev Stop – setting stop-losses using price volatility.pdf ” is searched on google.Thanks
Hey Brad, please find me a clear formula and I’ll code it, no worries. Your help is appreciated about this trading concept, but I don’t have time to spend on e-book mining to find the right thing to code 🙂 I hope you understand!
Hi Nicolas,
No eBook mining necessary. (-:
(Although I thought the code I posted above would be enough as you’d already coded the Dev Stop before with Std Dev skew %’s)
Cynthia Kase last improved her unique Deviation Stop in 2005. (Kase Dev Stop – setting stop-losses using price volatility.pdf)
“A stop that is going to perform optimally must consider the variability of range, not just the average. So I developed the DevStops, where “Dev” stands for standard deviation. The DevStop employs the True Range of two bars (2 x TR). The value of the stop amount is calculated as follows:”
DTR (double true range) = max((H – L[2]), abs(H – C[2]), abs(L – C[2]))
StopAmount = average(2 x TR, n) + stddev(2 x TR, n)
——————————————————————————————————————
There are 4 lines: A Warning Line and Dev Stop 1, 2 and 3.
Warning Line = average(2 x TR, n) + 0*stddev(2 x TR, n)
Dev 1 = average(2 x TR, n)+1*stddev(2 x TR, n)
Dev2 = average(2 x TR, n) + 2.2*stddev(2 x TR, n)
Dev3 = average(2 x TR, n) + 3.6*stddev(2 x TR, n)
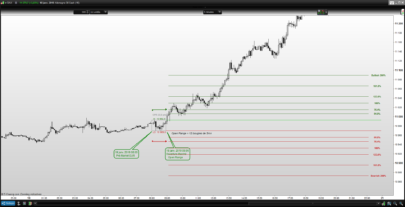
(from Kase Dev Stop – setting stop-losses using price volatility.pdf) DevStop in action on Copper chart: https://dl.dropboxusercontent.com/u/46130788/DevStopCopper.png
——————————————————————————————————————
Nicolas, do you think, seeing as Kase doesn’t provide the code to attach the 5 day moving average cross with a 21 day (so that it will flip the Stop from being above for Short positions to below for Long positions) – that you could provide a solution? This will allow any PRT users to customise the Dev Stop and use any other defining conditions for long or short entries.
I also found a website that had coded the Dev Stop using the Random Walk Index:
———————————————————————————————————————————
#PARAM “Periods”,30,2,100 ‘ default, min, max
Dim RWH, RWL, PK, AVTR, SD, ATRmult as Single
Dim Val1, Val2, Val3, Val4 as Single
Pk – means Peak
ATRmult = Periods^0.5 ‘simplify calc to get past %#&$! parser
RWH = (H-L[1]) / (ATR(Periods)*ATRmult)
RWL = (H[1]-L) / (ATR(Periods)*ATRmult)
PK = Mov((RWH-RWL),3,”W”)
AVTR = Mov(HHV(H,2) – LLV(L,2),20,”S”)
SD = STD(HHV(H,2) – LLV(L,2),20)
‘plot in same sequence as calc otherwise only 1st line plots
Val4 = IF(PK>0,HHV(H-AVTR-3*SD,20),LLV(L+AVTR+3*SD,20))
Val3 = IF(PK>0,HHV(H-AVTR-2*SD,20),LLV(L+AVTR+2*SD,20))
Val2 = IF(PK>0,HHV(H-AVTR-SD,20),LLV(L+AVTR+SD,20))
Val1 = IF(PK>0,HHV(H-AVTR,20),LLV(L+AVTR,20))
PlotPrice(“Val4”, Val4,Black,1)
PlotPrice(“Val3”, Val3,Green,1)
PlotPrice(“Val2”, Val2,Blue,1)
PlotPrice(“Val1”, Val1,Red,1)
Return 0
———————————————————————————————————————————
I am not sure why they have included the RWI? Kase makes no mention of it in the Kase Dev Stop – setting stop-losses using price volatility.pdf.
As far as I know Kase uses a Logarithmic / Serial Dependancy Calculation only, in her Kase PeakOscillator and the KaseCD indicators. (http://www.kaseco.com/support/whitepapers/Kase%20StatWare.pdf). So I am not sure if the linear RWI found on this forum should be used in those 2 indicators?
Kase’s approach might explain why she was getting 75% accuracy (as opposed to about 56% using traditional Stochastics) in defining market turning points on over 80 years worth of commodity data.
Volatility = stddev (ln(P/P[1])n)
KSDI (up) = (ln(H/Ln))/volatilityn
KSDI (down) = (ln(L/Hn))/volatilityn
“What the index does, when looking at “up” markets, is divide the natural logarithm (log to base e – an “existential” number) of the high n days ago to the low today, by the volatility, which is also logarithmically based. The opposite calculation is made for the “down” as shown below. Since volatility is a one standard deviation logarithmic rate of change, we can think of it as a standard of measurement for the market. The higher the ratio of the actual market movement to this measure, the more it is exhibiting serial dependency – or “trendiness”. Should prices move to about two standard deviations, there is less than a 3% chance that the “trend” will continue and prices will then be expected to revert.“
Also do you know why cant I post the Dev Stop image here – there’s no add image button?
Thanks for your help,
Brad
Hi Brad, this formula :
There are 4 lines: A Warning Line and Dev Stop 1, 2 and 3.
Warning Line = average(2 x TR, n) + 0*stddev(2 x TR, n)
Dev 1 = average(2 x TR, n)+1*stddev(2 x TR, n)
Dev2 = average(2 x TR, n) + 2.2*stddev(2 x TR, n)
Dev3 = average(2 x TR, n) + 3.6*stddev(2 x TR, n)
Only deal with true range which is not price but range of price on the last 2 periods. So it returned only range values that cannot be set on a price chart without adding them to a price.. So since it determines stoploss, on what price do you think it may be added to? On Close? or High for bearish trend / Low for bullish trend?
Here is the code with the flip of the curves defined by moving average crossing:
//pararemeters:
n = 20
periodFast = 5
periodSlow = 21
avg = average[n](2*TR)
st = std[n](2*TR)
WarningLine = avg
maFast = average[periodFast](close)
maSlow = average[periodSlow](close)
if maFast<maSlow then
Dev1 = avg + st
Dev2 = avg + 2.2*st
Dev3 = avg + 3.6*st
else
Dev1 = avg - st
Dev2 = avg - 2.2*st
Dev3 = avg - 3.6*st
endif
RETURN Warningline as \"WarningLine\", Dev1 as \"Dev1\", Dev2 as \"Dev2\", Dev3 as \"Dev3\"
Hi Nicolas,
Sorry for the delay answering, I didn’t get an email notification for your reply? How do I get those?
It looks like the calculations have to be made from the ‘Mean’ as Kase wrote: “Notice the stop uses a double true range, which I found after extensive research to work better than the single. For the actual stops, I use a default of 30 for n, and calculate the average (0), 1, 2.2 and 3.6 standard deviations over the mean.” The only option in PRT seems to be to use something like the “Typical (H+L+C)/3”
When I do add it to the top Price Chart the Dev Stops are miles below the price?
I read that Kase also used more/wider DevStops: (4.5 and 6 Std Deviations). I emailed kase StatWare to find out what the significance of the other columns of data meant and attached the explanation to the bottom of the image: https://dl.dropboxusercontent.com/u/46130788/KaseDevStops.pngAlso do you know why cant I post the Dev Stop image here – there’s no add image button and why clicking on the “add link” the button makes this page jump to the bottom of the page?
Also I think the Dev 1 to 3 could do with some colours don’t you think?
Thanks very much for figuring this out. (-:
Best Brad
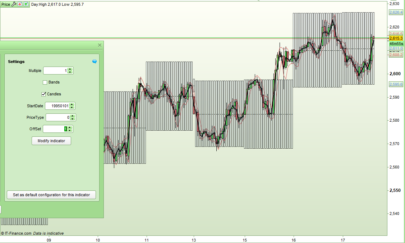
Yes it’s miles away from price, that’s why I asked you about an idea about it :)Well I recoded the double true range in the code below and add/substract the deviation of it. Now the indicator appears on price. That’s an improvment, even if i’m not sure of it is actually the same as the original.About email notification, image post and links, these are bugs i’m chasing.. sorry for inconvenience.here is the modified code :
//pararemeters:
n = 20
periodFast = 5
periodSlow = 21
DTR = max(max(High - Low[2], abs(High - Close[2])),max(abs(Low - Close[2]),(abs(Low - Close[2]))))
price = typicalprice
avg = average[n](DTR)
st = std[n](DTR)
maFast = average[periodFast](close)
maSlow = average[periodSlow](close)
if maFast<maSlow then
WarningLine = price+avg
Dev1 = price+avg + st
Dev2 = price+avg + 2.2*st
Dev3 = price+avg + 3.6*st
else
WarningLine = price-avg
Dev1 = price-avg - st
Dev2 = price-avg - 2.2*st
Dev3 = price-avg - 3.6*st
endif
RETURN Warningline as \"WarningLine\", Dev1 as \"Dev1\", Dev2 as \"Dev2\", Dev3 as \"Dev3\"
I’m an optimist so I always assume it’s my computer or software set up/code that’s causing any discrepancies (-:Thanks for sorting this out Nicholas, I think it’s correct and as Kase designed it. No? Kase used the Dev Stops with her other indicators called the Kase PeakOscillator and KaseDC. They are proven 75%+ accurate at predicting market turns over 80 years of backtested data. It would be great to get these two indicators adjusted so they include the Serial Dependency Index that Kase developed. Can I post the details of that index code here: http://www.prorealcode.com/prorealtime-indicators/kase-peak-oscillator/ ? I added the colours according to one of Kase’s images of the Dev Stop: (Solid Warning Line, Dotted Dev Stops.)RETURN Warningline coloured(255,0,0) as “WarningLine”, Dev1 coloured(2, 118, 253) as “DevStop1”, Dev2 coloured(20, 100, 244) as “DevStop2”, Dev3 coloured(1, 71, 250) as “DevStop3”Once again, thanks very much.
Yes Brad, do it. Post your other request on the dedicated indicator post. Thanks.
I’ll update this one with the recent code, thanks for your assistance.
Can anyone explain to me what Low[2] and Close[2] mean exactly?
The above-mentioned Kase’s research white paper link was broken and not working. http://www.kaseco.com/support/whitepapers/Kase%20StatWare.pdf
Or is this the one? http://www.kaseco.com/support/articles/How_Well_Do_Traditional_Momentum_Indicators_Work.pdf
or http://www.kaseco.com/kase-learning-and-support-center/kase-premium-books-and-videos/
the above