







Guppy Indicator
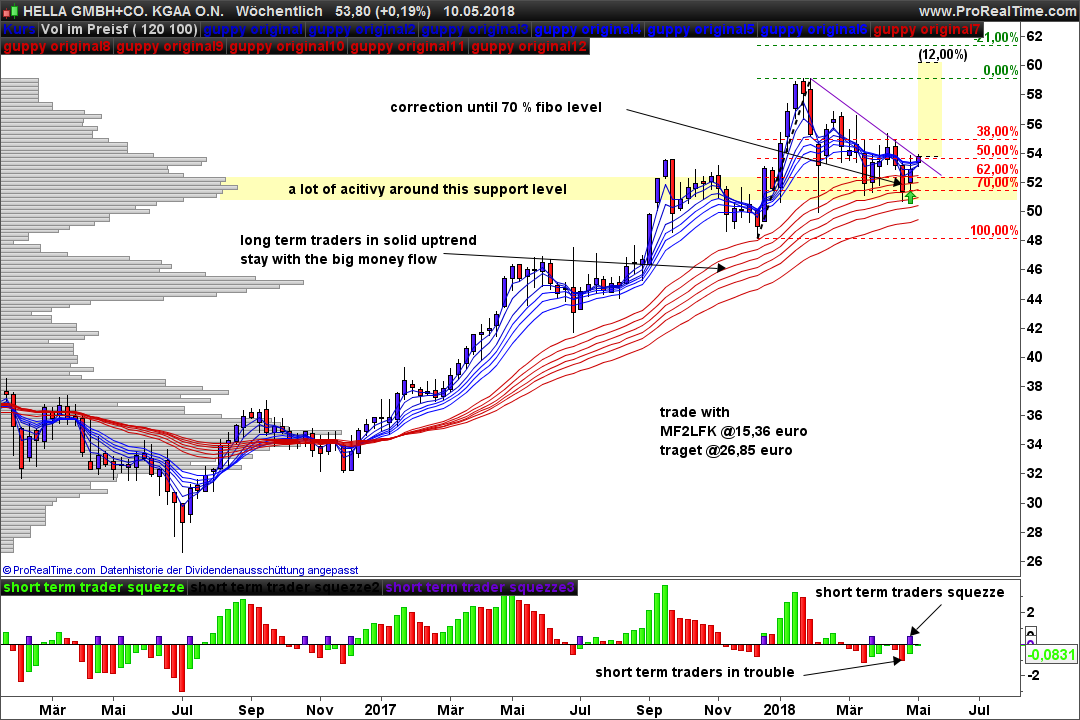
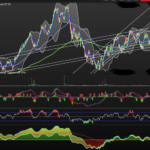
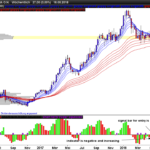
the original guppy indicator, with the short term traders (blue) and long term investors (red)
go only with the trend of the long term investors, and search for trouble in the short term traders (blue) to find good entries.
a = close
c1 = ExponentialAverage[3](a)
c2 = ExponentialAverage[5](a)
c3 = ExponentialAverage[8](a)
c4 = ExponentialAverage[10](a)
c5 = ExponentialAverage[12](a)
c6 = ExponentialAverage[15](a)

c7 = ExponentialAverage[30](a)
c8 = ExponentialAverage[35](a)
c9 = ExponentialAverage[40](a)
c10 = ExponentialAverage[45](a)
c11 = ExponentialAverage[50](a)
c12 = ExponentialAverage[60](a)

return c1, c2, c3, c4, c5, c6, c7, c8, c9, c10, c11, c12
i use it on weekly data for lower market noise.
Comments
You must be logged in to post a comment.





here is my code c1 = ExponentialAverage[3](close) c2 = ExponentialAverage[5](close) c3 = ExponentialAverage[8](close) c4 = (c1-c2)*100/c2 c5 = (c2-c3)*100/c3 c7 = (c1-c3)*100/c3 c6 = (c4+c5+ c7)/3 Color = 0 IF (c6 > c6[1]) then Color = 1 ELSIF (c6 c6[1] and c6[1] < c6[2] and c6[1] < 0 then result = 0.5 else result = 0 endif RETURN c6 Coloured By Color,0, result

Hi, as I see it, when close is below the blues or crossing it downwards

Thanks Nicolas, worked a treat.