G-Channels – Efficient Calculation Of Upper/Lower Extremities

G-Channels – Efficient Calculation Of Upper/Lower Extremities

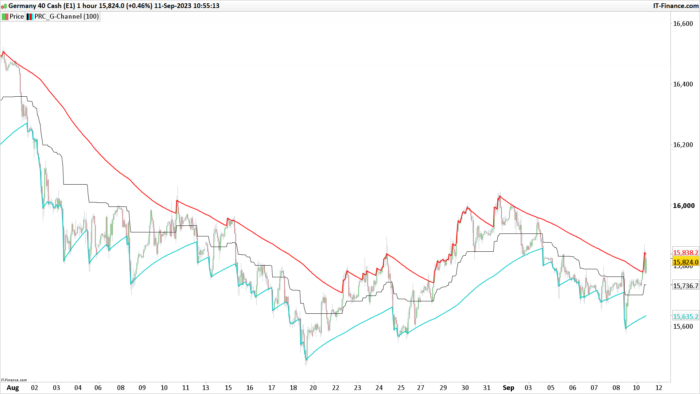
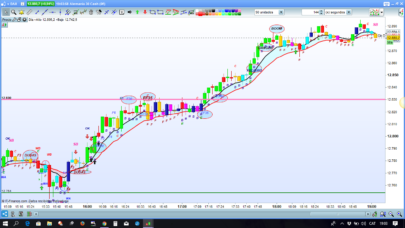
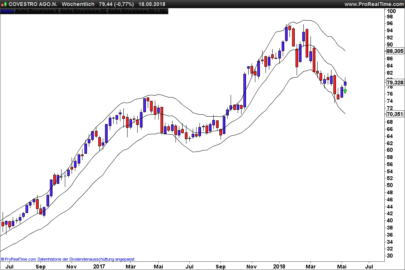
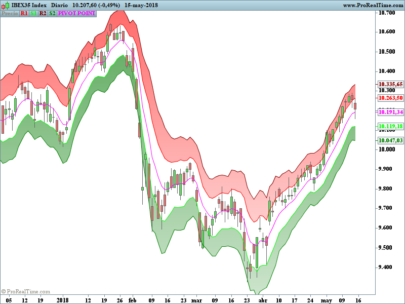
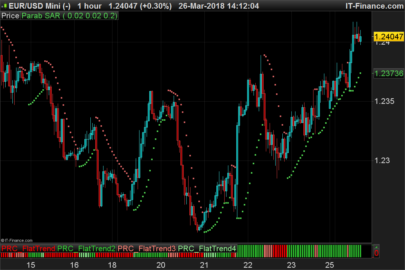
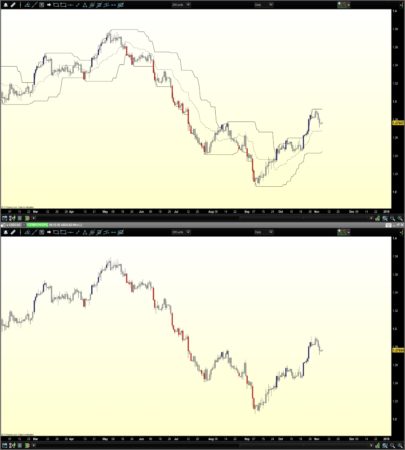
Channels indicators are widely used in technical analysis, they provide lot of information. In general, technical indicators giving upper/lower extremities are calculated by adding/subtracting a volatility component to a central tendency estimator. This is the case with Bollinger bands, using the rolling standard deviation as volatility estimator and the simple moving average as central tendency estimator, or the Keltner channels using the exponential moving average and the average true range.

Lots and lots and lots of those indicators have been made, they only really need a central tendency estimator, which can be obtained from pretty much any filter, however i find interesting to focus on the efficiency of those indicators, therefore i propose a super efficient channel indicator using recursion. The average resulting from the upper/lower extremity of the indicator provide a new efficient filter similar to the average highest/lowest.

The calculation – How Does It Works:

Efficiency is often associated to recursion, this would allow us to use past output values as input, so how does the indicator is calculated? Lets look at the upper band calculation :

a = max(src,(a[1])) – (a[1] – b[1])/length

src is the closing price, a is upper extremity, b is the lower one. Here we only need 3 values, the previous values of a and b and the closing price. Basically a = max(src,a[1]) mean :

if the closing price is greater than the precedent value of a then output the closing price, else output the precedent value of a

therefore a will never be inferior to its precedent value, this is useful for getting the maximum price value in our dataset however its not useful to make an upper band, therefore we subtract this to a correction factor defined as the difference between a and b, this force the upper band to have lower values thus acting like a band without loosing its “upper” property, a similar process is done with the lower band.

Of course we could only use 2 values for making the indicator, thus ending with :

a = max(src,a[1]) – (abs(close – a[1])/length

(description from original author: alexgrover)

Share this

Risk disclosure:

No information on this site is investment advice or a solicitation to buy or sell any financial instrument. Past performance is not indicative of future results. Trading may expose you to risk of loss greater than your deposits and is only suitable for experienced investors who have sufficient financial means to bear such risk.

ProRealTime ITF files and other attachments : How to import ITF files into ProRealTime platform?

PRC is also on YouTube, subscribe to our channel for exclusive content and tutorials

  1. Alai-n • 09/11/2023 #

    I really like it when you develop ideas around price movement! I am much less a fan of all the indicators calculated with averages of this or that, too subjective in my opinion!

avatar
Register or

Likes

avatar avatar avatar avatar avatar avatar avatar avatar avatar
Related users ' posts
Nicolas
7 years ago
Maxime Baudin Interesting, Thank you! :)
franck-david Bonjour Nicolas , actuellement je me forme grace a vos videos tres tres bien expliques mer...
Nicolas Merci. ça n'est pas le lieu pour poser ce genre de question :) Merci d'utiliser le forum Pro...
Canale di Fill By Filippo si si... farò un video a breve
AngelPujalt ok. Gracias.
Stenozar Hi Filippo, any news about your video to explain how to use this indicator? thanks
Vonasi Discussion on this indicator/filter can be found here: https://www.prorealcode.com/topic/121...
Domenec Claro Juanjo de todas maneras en deinversoratrader.com tienes estsos osciladores evolucionad...
Dron Hola Domenec, en la descripción hablas del indicador velas de colores, no lo encuentro en la...
Domenec Hola Dron mira en el blog deinversoratrader.com en formacion indicadores ahi hay varios grat...
Nicolas Add it on price using the wrench on the left upper side of the price chart.
Stenozar thanks Nicolas, I' ll try again!
Radetzky Buongiono e grazie : l'immagine sopra ritrae l'indicatore sul TF 15 min ma a me funzio...
Steven Hi im looking for some help to put a automated code together BUY ORDER If EMA 10/25 is...
Dwell Thank you! Great tool!
Juanjo Hola?. Exactamente cuál es su utilización?.
bolsatrilera Hola Juanjo, su principio esparecido a las bandas de Bollinguer.Las lineas de las bandas son...
Geronima Ortiz I watched the video three times, but I can not put the npips parameter as a variable. I do...
Geronima Ortiz I think the video is for an old version of prorealtime, the images do not correspond at all ...
Nicolas indicator1 = CALL “PRC_StopReversal”[npips, 1] and define npips in the optimization window ...
Caribeengeek Bonjour j’avais vu que vous proposiez d’écrire des codes pour ceux qui s’y connaisse pas Mai...
Caribeengeek Les devises unité
Nicolas Merci d'utiliser le forum pour les demandes de programmation personnalisée
ullle73 nicolas, can you somehome make this to be in the background of the price chart?
jonpt88 none did that yet right?
Nicolas You can ask for a code modification on forums, please open a new topic with your request.
Toto le Heros Thanks Nicolas. I read somewhere that in the calculation, we should round the value of the A...
Nicolas aADX = round(adx[10])
bolsatrilera
8 years ago
Rainbow Oscillator
Rainbow Oscillator
1
Indicators
Maxime Baudin Interesting, thanks! Combine this indicator with the bollinger bands there is enough to make...
supertiti Bonsoir à tous For those who like me want to calibrate this indicator on a scale of 0 to ...
verdi55 You can find me at www.FXautomate.com Ahh. So i got it ? 4 different supertrends without th...
juanj What? This has nothing to do with the website. The site is simply a service to help people ...
Nicolas Advertising is allowed,as long as people are helping others and if provided services are abo...
styrke Hello Nicolas, Nice screener, I appreciate the way you always try to condense at maximum th...
Nicolas There's no particular reason. RSI is widely use with its default period and results seems re...
Vonasi I noticed a couple of typo errors in the code. The list of variables lines 4 to 11 should be...
Genotik Thank you for your important contribution this week which is much appreciated! Happy New Yea...
Vonasi No problem. I hope they are useful to someone. Happy and hopefully prosperous New Year to y...
DarioMazza Hi Vonasi, i have a question for you, the comand "pricetype" where did you found it in the ...
Vonasi PriceType is just a variable that I use. The value decides what type of price is used in the...
Vonasi I noticed a couple of typo errors in the code. The list of variables lines 4 to 11 should be...
Nicolas
8 years ago
Trinity Impulse
Trinity Impulse
5
Indicators
ribou ah d'accord merci beaucoup
domenico nlevel1 non modifica la curva al variare del suo valore
tiger_man_no1 Very nice ; what is the best period input date for DAILY CHART ?
Marcel If you are interested in my way of trading, please follow me on Twitter @MvvTrading
Genotik Excellent, merci !
diegofe_2000 Excelente indicador, felicitaciones, muy bueno

Top