Fisher Transform

Fisher Transform

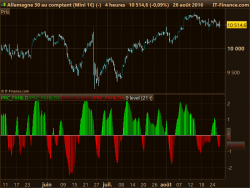
The Fisher Transform attempts to be a major turning point indicator.

Parameters

Length (Len = 13)

O/B (a = 5)

O/S (b = -5)

Share this

Risk disclosure:

No information on this site is investment advice or a solicitation to buy or sell any financial instrument. Past performance is not indicative of future results. Trading may expose you to risk of loss greater than your deposits and is only suitable for experienced investors who have sufficient financial means to bear such risk.

ProRealTime ITF files and other attachments : How to import ITF files into ProRealTime platform?

PRC is also on YouTube, subscribe to our channel for exclusive content and tutorials

  1. iioixi • 10/12/2015 #

    Value1 = ( (MEDIANPRICE – MinL)/(MaxH – MinL) – .5) + .67 * Value1
    Please explain the meaning of this line formula. Why is it different from the original? The original formula is to format the oscillation + – 1 and filter it with equation
    EMA = alpha * close + (1 – alpha) * EMA[1];

    • Nicolas • 10/12/2015 #

      FYI, other Fisher related posts: (and with other fisher transform method): https://www.prorealcode.com/tag/fisher/

  2. SB-FO • 10/12/2015 #

    Question for Nicolas or others. Should the Fisher Transformer price / bar be based on MEDIANPRICE as above, or Typically Price?

    Thanks for your help, Stuart

    • Nicolas • 10/12/2015 #

      Use the data serie you want. Replace MEDIANPRICE by TYPICALPRICE in the above code.

  3. SB-FO • 10/12/2015 #

    Thanks Nicolas. While I understand I can use either Median or Typical (Price), the question was which is correct or perhaps better to use?

    • Nicolas • 10/12/2015 #

      I don’t know. MedianPrice (exact mid price of the candlestick) tends to be smoother than TypicalPrice.

  4. SB-FO • 10/12/2015 #

    Good to know and thank you.

    Oh, on this indicator, how do I change the range from 5/-5 to 1/-1?

  5. SB-FO • 10/12/2015 #

    Nicolas, on the Trigger formula, Trigger=fish[1] , is that mean it is using linear / moving linear regression of 1 of Fish, or something else? I don’t understand what the [1] mean /do.

    Fish = 0.5*Log((1 + Value1)/(1 – Value1)) + .5 * Fish

    Thank you for the help understanding this.
    Trigger=fish[1]

    • Nicolas • 10/12/2015 #

      Trigger is just the value of fish of the previous bar, the blue line.

  6. SB-FO • 10/12/2015 #

    Ah ha. So FISH – 1 so to speak. I would have thought that would have been coded as [-1].

    I have played with a SMA of 4 for the trigger on D charts and it seems nicely profitable. When I back-test standard it losses money. Hence why i was trying to figure it out. I need to back-test 4H time frames.

    Thank you for your help.

    Stuart

  7. SB-FO • 10/12/2015 #

    Nicolas, sorry to bother you again. In trying to turn this indicator into a strategy in PRT I am doing something wrong. I had assumed Len is Length of Fish. When i back best in PRT, it does not make a trade, or no second trade. Can you PLEASE advise? I have copies the code below.

    DEFPARAM CumulateOrders = True // Cumulating positions activated
    capital = 100000 + strategyprofit
    Equity = capital / close
    myCurrentProfit = STRATEGYPROFIT

    Len = 9

    IF BARINDEX .99 then
    Value1 = .999
    ENDIF

    If Value1 < -.99 then
    Value1 = -.999
    ENDIF

    Fish = 0.5*Log((1 + Value1)/(1 – Value1)) + .5 * Fish
    Trigger = Average[4](close)

  8. SB-FO • 10/12/2015 #

    Found my mistake, should have been Trigger = Average[4](Fish)

  9. Derek • 10/12/2015 #

    In line 10 there is a value missing for the calculation. You can cross check it here on page 4: https://www.mesasoftware.com/papers/UsingTheFisherTransform.pdf
    Line 10 should be:
    Value1 = (.66* ((MEDIANPRICE – MinL)/(MaxH – MinL) – .5)) + .67 * Value1

  10. Coldtrade • 10/12/2015 #

    Hello. I’m new to programming and don’t understand the algebraic meaning of the formula:
    Value1 = (.66 * ((MEDIANPRICE – MinL) / (MaxH – MinL) – .5)) + .67 * Value1
    Isn’t that like saying A = B + n * A?
    Something substantial escapes me, thanks to those who want to help me.

  11. Derek • 10/12/2015 #

    You are right, There is something odd with this line of code. It should be
    A = B + n * A[1].
    So, there are two things missing in line 10.
    Ps. Sorry for the late reply

avatar
Register or

Likes

avatar avatar
Related users ' posts
Bruno Carnazzi Moyenne mobile intéressante, dommage qu'elle soit si gourmande en puissance de calcul. Les v...
PeP2016 Hi, simple and nice idea. One question though: I read it removes small price fluctuations ...
Lior Green Doesn't work for me. Set values “compra” and “venta” to be shown as HISTOGRAM
Nicolas
9 years ago
thomas2004ch Hi Nicolas, >>This indicator code is not the one of the MACD divergence indicator a...
thomas2004ch I think I've found it. My questions: 1. Do you have the source code? 2. The following ...
Nicolas Hi, I'm not the author of this indicator. The MACD divergence source code of the one embedd...
s00071609 Hi, could you please suggest, what this codes gives, lowest[b](rsi[a]) -- just trying to us...
Nicolas lowest[b](rsi[a]) returns the lowest values of the RSI of "a" periods, over the last "b" per...
s00071609 Hi, what would be the code to get the price for last bullish DTOSC cross over. I am looking ...
xel @DerPat - I don't see any question regarding the indicator.  Anyway, I think I give enough l...
diegofe_2000 Xel, tu eres el creador de este indicador? Bueno te  cuento que es muy bueno para hacer est...
xel Buen día @diegofe_2000 -  Claro, mandalo y por aquí lo probamos en otros instrumentos y si g...
Doctrading I forgot to write at the beginning :  a = 50 b = 50 These are intermediate levels Sorry
DerPat Thank you. This one could be an aid in my current research on stochastics.
Pelayo it is possible that in line 12 we should put seuilinf=-b, thaks for all
Nicolas Thank you Pere!
M.Nicolas 81 Hola Nicolas. ¿Existe la posibilidad de que este indicador se muestre también en el históri...
Nicolas That would be possible to be coded using MTF indicator in PRT v11.
Nicolas
9 years ago
Bill Williams Fractals
61
Indicators
stevzor Hi - bit of an old post but hopefully you see my comment lol. I'm trying to add this Wil...
Nicolas Add it on the price by using the wrench on the left upper side of the price chart.
withoutwings Hi All, I've made some fixes & upgrades so that this single script can either used as...
Nicolas
9 years ago
Pivot points intraday
5
Indicators
Nicolas Why are you asking this question there? (and in other places in the forums that don't have a...
Brisvegas Nice code Nicholas and well done on writing it but in my opinion and mine only pivot points ...
Nicolas Thanks for the input and your opinion, but IMO, the pivot points are ones of the best suppor...
Nicolas
9 years ago
ATR percentile rank
ATR percentile rank
4
Indicators
Nicolas This indicator rank the actual ATR to its recent statistical values. So you can have a bette...
Brisvegas Thanks Nicolas , very handy tool , I have added variables to look back period and ATR perio...
rufus.round How easy is it to remove the overnight intraday bars from the calculation?
supertiti
9 years ago
CCI Magic DID V1
v10.3
CCI Magic DID V1
11
Indicators
supertiti Hola Angel Las funciones backgroundcolor etc etc no funcionan con la version 10.2. Para sa...
Lotech123 It may be a little late in the day, but having only just discovered this utility, I have mes...
Henry
9 years ago
SuperTrend
SuperTrend
4
Indicators
Nicolas Exit and relaunch PRT should fix this behavior.
verdi55 Thank you. After a restart, it is somewhat faster; however, it still takes about 3 minutes t...
Nicolas Good! thanks for sharing your own code! Please do so with other ones if you think you can im...
Nicolas
9 years ago
Toto8 Hello, When I use the code above with no change at all, I get an error message stating that...
fabien philipp Hi, I have the same message error by importing the itf file, or by copying and pasting the ...
mcha bonjour, merci pour cet échange mais il me semble que ce twist des SSA  et SSB serait plus ...
Pasq Concernant la remarque précédente, il est possible de remplacer les 2 lignes de code de cett...
Nicolas Merci Pasq. On peut retrouver ce code corrigé sur le forum, je viens d'en retrouver un exemp...
tahar Bonjour, je travaille sur un ecran noir et les bougies sont extremement palotes, on distingu...
Alai-n Voir Echantillons de Couleurs RVB : https://www.prorealcode.com/documentation/category/instr...
Guillaume34 Bonjour, quelqu'un à t'il réalisé ce code à l'identique mais pas dans une fenêtre sous le gr...
Doctrading
9 years ago
Nicolas Use Highs and Lows instead
Doctrading This new code with highs and lows seems to work : boxSize = 20 // On aime bien que...
DonDollar Gentlemen, just a quick question. When I am adding this column to my code, PRT shows an err...
Cavok Bonjour, Comment utiliser cet indicateur comme screener? Merci.
rajiwas Hello Nicolas, With Daily Pivot, it easy for me to show current day pivot e.g. if Date = T...
Nicolas You'll find many other pivots points indicators in the library, just use the search box of t...
rajiwas Thanks for the suggestion.
pepkatapet
9 years ago
supertiti Pour Nicolas Ne peux t'on pas ajouter un bouton  pour illustrer une suggestion par un graph...
Lyny @supertiti, can you translate your code into English version PRT ? I copy and paste your cod...
zen83 The bands 30 and 70 can also be added as supra-sold / super-purchased // RSI with volatile s...
Nicolas
9 years ago
Kase Peak Oscillator
9
Indicators
Bard Hi Nicolas, re-upping the coding request as you suggested for the genuine version of Kase's ...
Nicolas FYI: I found this other code in an old NL forum:  pri=Customcloselen=psmooth=catr = Average...
Bard Thanks very much Nicolas, but I can't post my reply here if I want to add a url link. When I...

Top