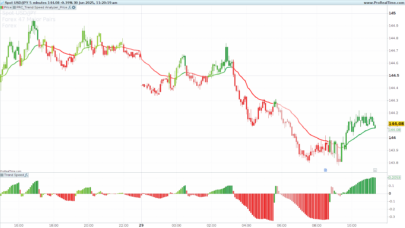
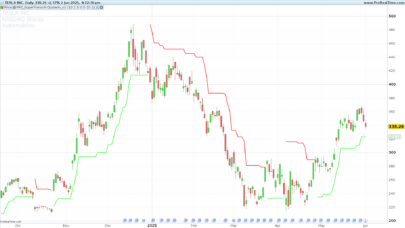
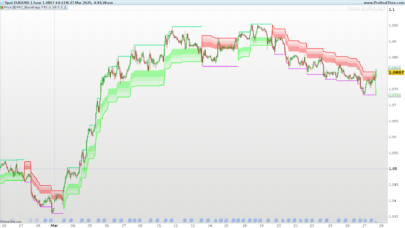
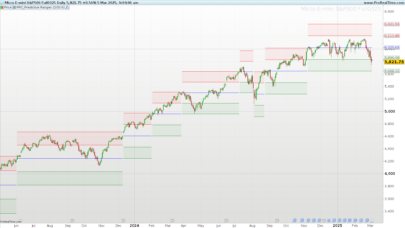
Displays 52 Week HIGH and 52 Week LOW lines on chart. Useful for detecting breakouts or breakdowns. Enjoy.
Use on Daily Chart with default parameters.
Parameters
52 Week High (a = 250)
52 Week Low (b = 250)
|
1 2 3 4 |
High52Band = Highest[a](Close) Low52Band = Lowest[b](Close) Return High52Band as"High52Band", Low52Band as"Low52Band" |
Share this
No information on this site is investment advice or a solicitation to buy or sell any financial instrument. Past performance is not indicative of future results. Trading may expose you to risk of loss greater than your deposits and is only suitable for experienced investors who have sufficient financial means to bear such risk.
ProRealTime ITF files and other attachments :
Find other exclusive trading pro-tools on ![]()
PRC is also on YouTube, subscribe to our channel for exclusive content and tutorials