







Matrix Series - Flower indicator

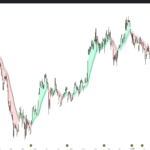
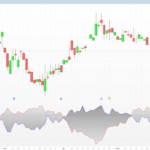
This indicator spot potential reversal of the market while identifying Accumulation/Distribution zones. It is compatible with any instrument and timeframe, parameters should be adapted at will. Each levels can act like support and resistance.
The blue dots appear when the oscillator is piercing the +200 overbought level of the -200 oversold level.
This indicator is only compatible for Prorealtime version 10.3
//--External parameters
//Smoother=5
//SupResPeriod = 50
//SupResPercentage = 100
//PricePeriod = 16
//ob = 200
//os = -200

nn = Smoother

ys1 = ( high + low + close * 2 ) / 4
rk3 = exponentialaverage[nn](ys1)
rk4 = std[nn](ys1)
rk5 = (ys1 - rk3 ) * 200 / rk4
rk6 = exponentialaverage[nn](rk5)
up = exponentialaverage[nn](rk6)
down = exponentialaverage[nn](up)

if up<down then
 Oo = up
else
 oO = down
endif

if up<down then
 Ll = down
else
 Ll = up
endif
Cc = Ll

if up<down then
 DRAWCANDLE(Oo,Cc,Oo,Cc)COLOURED(200,0,0)
else
 DRAWCANDLE(Oo,Oo,Cc,Cc)COLOURED(0,200,0)
endif

//-------S/R Zones------
Lookback = SupResPeriod
PerCent = SupResPercentage
Pds = PricePeriod

C3 = cci[Pds](close)

Osc = C3
Value1 = Osc
Value2 = highest[Lookback](Value1)
Value3 = lowest[Lookback](Value1)
Value4 = Value2 - Value3
Value5 = Value4 * ( PerCent / 100 )
ResistanceLine = Value3 + Value5
SupportLine = Value2 - Value5

//--Overbought/Oversold/Warning Detail
UPshape = up > 200 and up>down
DOWNshape = down < -200 and up>down

if UPshape then
 DRAWTEXT("+",barindex,highest[1](up)+20,Dialog,Bold,20) coloured(102,255,255)
endif
if DOWNshape then
 DRAWTEXT("+",barindex,lowest[1](down)-20,Dialog,Bold,20) coloured(102,255,255)
endif

RETURN ResistanceLine COLOURED(0,200,0) STYLE(dottedline,1) as "Resistance line", SupportLine COLOURED(200,0,0) STYLE(dottedline,1) as "Support line"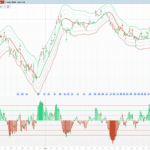
Comments
You must be logged in to post a comment.

Bonjour Nicolas,
Je viens d'essayer ton indicateur, il fonctionne parfaitement sur EURUSD, EURJPY et USDJPY, par contre sur AUDUSD il n'apparait pas, tout comme GBPUSD.
Qu'est ce qu'il faudrait faire pour le voir apparaitre selon toi?
Je joins une capture pour avoir une idée
Je te remercie pour tout.


Hi Nicolas,
I try to explain my problem: for example if I zoom out the 3 min chart, the matrix indicator will collaps.
Sometimes the indicator work on the 1 min, and sometime not. for example if you take the 1 min graph with 100 units and you scroll back to midnight you see the indicator. And if you scroll back to real time it will collaps.
hopefully you understand what I am meaning ;-)
image:
http://nl.tinypic.com/r/novojm/9
http://nl.tinypic.com/r/105thdv/9


@wp01, you can graph the difference between up and down: it will be positive if the bars are green, and negative if the bars are red. So you can easily switch between longs and shorts.
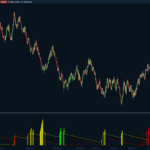
I changed the bar colors to understand better the curve, if you want you can test it. Sorry, I have not access to the "Insert PRT code" button.
//Matrix Series-Flower Indicator
//--External parameters
//Smoother=5
//SupResPeriod = 50
//SupResPercentage = 100
//PricePeriod = 16
ob = 200
os = -200
nn = Smoother
ys1 = ( high + low + close * 2 ) / 4// Weighted price
rk3 = exponentialaverage[nn](ys1)
rk4 = std[nn](ys1)
rk5 = (ys1 - rk3 ) * 200 / rk4
rk6 = exponentialaverage[nn](rk5)
up = exponentialaverage[nn](rk6)
down = exponentialaverage[nn](up)
if up<down then
Oo = up
else
oO = down
endif
if up<down then
Ll = down
else
Ll = up
endif
Cc = Ll
dif=up-down
if up<down and up<up[1] and dif<0 and dif>dif[1] then
DRAWCANDLE(Oo,Oo,Cc,Cc)COLOURED(255,160,122)//light salmon
elsif up<down and up<up[1] then
DRAWCANDLE(Oo,Cc,Oo,Cc)COLOURED(200,0,0)//red
elsif up<down and up>up[1] then
DRAWCANDLE(Oo,Cc,Oo,Cc)COLOURED(255,215,0)//yellow
elsif up>down and up>up[1] and dif>0 and dif<dif[1] then
DRAWCANDLE(Oo,Oo,Cc,Cc)COLOURED(127,255,212)//aquamarine
elsif up>down and up>up[1] then
DRAWCANDLE(Oo,Oo,Cc,Cc)COLOURED(0,200,0)//green
elsif up>down and up<up[1] then
DRAWCANDLE(Oo,Oo,Cc,Cc)COLOURED(255,215,0)//yellow
endif
//-------S/R Zones------
Lookback = SupResPeriod
PerCent = SupResPercentage
Pds = PricePeriod
C3 = cci[Pds](close)
Osc = C3
Value1 = Osc
Value2 = highest[Lookback](Value1)
Value3 = lowest[Lookback](Value1)
Value4 = Value2 - Value3
Value5 = Value4 * ( PerCent / 100 )
ResistanceLine = Value3 + Value5
SupportLine = Value2 - Value5
//--Overbought/Oversold/Warning Detail
UPshape = up > ob and up>down
DOWNshape = down < os and up<down
if UPshape then
DRAWTEXT("+",barindex,highest[1](up)+30,Dialog,Bold,20) coloured(0,0,255)
endif
if DOWNshape then
DRAWTEXT("+",barindex,lowest[1](down)-30,Dialog,Bold,20) coloured(0,0,255)
endif
RETURN ResistanceLine COLOURED(0,200,0) STYLE(dottedline,2) as "Resistance line", SupportLine COLOURED(200,0,0) STYLE(dottedline,2) as "Support line", ob AS "ob", os AS "os", 0 AS "Zero", dif AS "Dif"

Hi Nicolas. It looks great :-).
Have you tested it on lower timeframes?
I have too ask since I cant test it myself since I dont have V.10.3
Dear Nicolas,
Regarding this indicator. If i select the wizard to create the conditions for a buy and a sell signal i can only select the candle and the resistance and support line.
My idea is for example to go long when the candle changes from red to green and go short from green to red in any timeframe.
Can you please tell me how i can adjust and implement this in the code?
Thanks.
regards,
Patrick

On peut faire varier le seuil des surachats /surventes; en bougeant les seuils par action on peut affiner les points de retournements.


//--Overbought/Oversold/Warning Detail
// UPshape = up > 200 and up>down
UPshape = up > ob and up>down

// DOWNshape = down < -200 and up>down
DOWNshape = down < os and up>down
Bonjour Nicolas. Je trouve cet indicateur intéressant et j'essaie de l'intégrer dans une stratégie . Je me demandais si la ligne 126 ne devrait-elle pas être DOWNshape = down < -200 and up < down Salutations