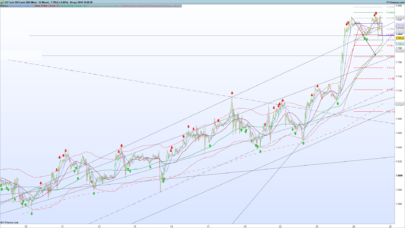
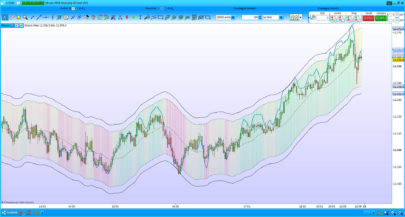
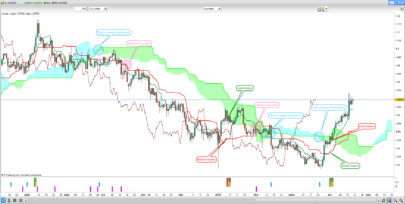
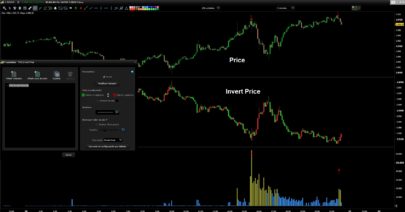
Finite Volume Element (FVE)

Finite Volume Element (FVE)

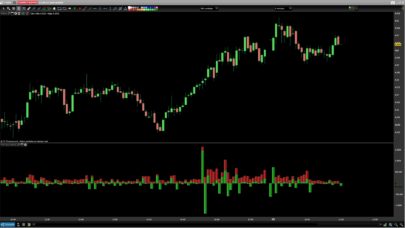
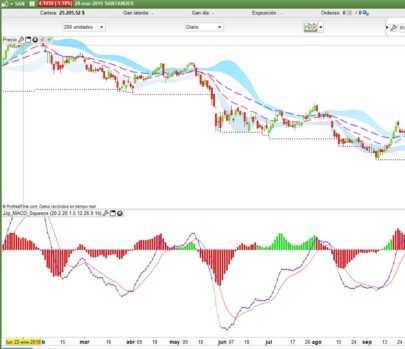
FVE is a money flow indicator but with two important differences from existing money flow indicators:

It resolves contradictions between intraday money flow indicators (such as Chaikin’s money flow) and interday money flow indicators (like On Balance Volume) by taking into account both intra- and interday price action.
Unlike other money flow indicators which add or subtract all volume even if the security closed just 1 cent higher than the previous close, FVE uses a volatility threshold to take into account minimal price changes.
The FVE provides 3 types of signals:

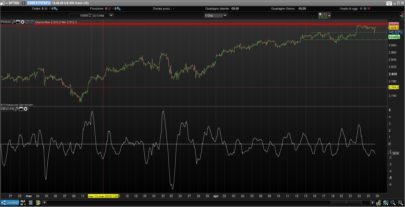
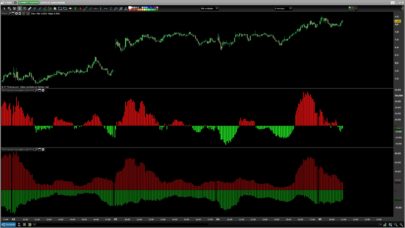
The strongest signal is divergence between price and the indicator. Divergence can provide leading signals of breakouts or warnings of impending corrections. The classic method for detecting divergence is for FVE to make lower highs while price makes higher highs (negative divergence). An alternative method is to draw the linear regression line on both charts, and compare the slopes. A logical buy signal would be for FVE, diverging from price, to rise sharply and make a series higher highs and/or higher lows.
The most obvious and coincident signal is the slope of the FVE line. An upward slope indicates that the bulls are in control and the opposite for downward.
This is a unique and very important property of this indicator. Values above zero are bullish and indicate accumulation while values below zero indicate distribution. FVE crossing the zero line indicates that the short to intermediate balance of power is changing from the bulls to the bears or vice versa. The best scenario is when a stock is in the process of building a base, and FVE diverges from price and rises to cross the zero line from below, at a sharp angle. Conversely the crossing of the zero line from above is a bearish signal to liquidate positions or initiate a short trade.

Parameters

FVE period (p = 22)

Share this

Risk disclosure:

No information on this site is investment advice or a solicitation to buy or sell any financial instrument. Past performance is not indicative of future results. Trading may expose you to risk of loss greater than your deposits and is only suitable for experienced investors who have sufficient financial means to bear such risk.

ProRealTime ITF files and other attachments : How to import ITF files into ProRealTime platform?

PRC is also on YouTube, subscribe to our channel for exclusive content and tutorials

avatar
Register or

Likes

avatar avatar avatar avatar
Related users ' posts
Nicolas Il s'agit d'un indicateur compatible avec PRT v11 uniquement. Pour éviter les erreurs de cop...
Sébi Intéressant. Merci pour ce partage Nicolas. L'indicateur ne considère pas les divergences ...
Nicolas ok, pour les divergences chacun voit midi à sa porte je dirai :) Vu qu'il n'y a pas de formu...
Nicolas File and code are updated.
Zasinas2000 Hi allo I am not sure I am doing it correctly, but this adds to proreal as an indicator. ...
Trimicha Hi, when I copy the code, i get an error message that LinRegPeriod is not defined. Doe...
robertogozzi
6 years ago
M-Oscillator
M-Oscillator
10
Indicators
robertogozzi Sorry for my late reply. I’ll make it and open a new topic quite soon.
swapping ah ah ! je n'avais pas vue celui-ci, excellent robert ;)
robertogozzi Thank you swapping.
Nicolas change the lastline with: RETURN lastsig and check if lastsig change its value with the a...
nectouxg Hello Nicolas, I will try tonight when I get home, just one last question, I trade the DA...
FXtonio Bonjour, j'ai un problème avec le code, il me dit que ce n'est pas correct ligne 26-27-28: ...
Nicolas Good job Gabri, I confirm that with the new ProRealTime v11, everyone will be able to use in...
Slowlyslowly can u just help me with the exact definition of percbox , mm and period to understand will a...
Vinks_o_7 Great, thanks a lot Nicolas !
Teddy Coronak Top Nicolas ! Merci
Andyswede Thank's! Great indicator:)
mcha merci bien et félicitations pour la réactivité avec laquelle il a été mis dans la bibliothèq...
soulintact Great indicator Nicolas, thanks!
juanj
6 years ago
juanj I have actually completely redesigned this indicator with loads of improvements, so will res...
Didouqc Bonjour Nicolas, Merci pour cet indicateur, encore génial! Je souhaite faire une suggest...
cdc.andersson Hello, when trying to include this wonderful Dynamic RSI on my trading system i get the erro...
Rafyone Bonjour Nicolas et bonne année lol J'ai une erreur qui apparait concernant drawbarchart une...
Nicolas Je pense que tu n'utilises pas le bon éditeur de code, cette instruction est compatible uniq...
Kris75 Hi, This is great !! anyone ever developped a strategy about it ???
swapping hello Kris75, not that I know but it is possible to make a scenario ;)
digitation Hi swapping, Thanks for sharing this useful tool. I was wondering how difficult it would be...
Real Pro Great work gabri. I have this coded on Amibroker and I have done lots of backtesting but ne...
gabri Hi Real Pro, this indicator assists novices of the Wyckoff system. Wyckoff himself thought t...
tatie hi Gabri, I just came across the wyckoff method and was looking for the weiss wave indica...
Vonasi There is another version of this indicator that can plot the same lines but onto an indicato...
Martin35 Hello Vonasi, do you think it is possible with PRT to code with the same principle as on thi...
Vonasi A modified version of this indicator can be found here: https://www.prorealcode.com/topi...
abhay I am getting a shading between the lines, how can I avoid that. I just want to see lines as ...
Vonasi Delete the 'Color Zone' in the indicator settings window.
dau710 Are the Bulls Blue & the Bears Red?
dau710 Many thanks :)
Nicolas
7 years ago
Hans63 Thank you swapping
FREDNC @Nicolas merci pour se remarquable indicateur, reste à voir comment on va pourvoir l'intégre...
Diamant Bonjour à vous tous, D'après vous, quelle serais la bonne période pour du trading 15 minute...

Top