
EMA Trend Meter: An Essential Indicator for Trend Detection
Introduction
The “EMA Trend Meter” can be an interesting tool to identify the direction and strength of a financial asset’s trend. In this article, we will explain the indicator in detail, from its setup to its interpretation.
Fundamentals of the EMA Trend Meter
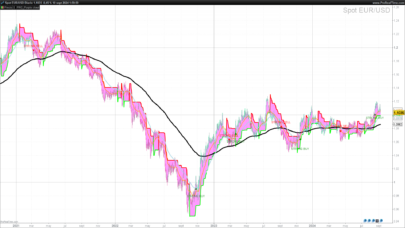
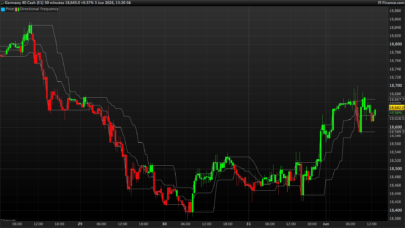
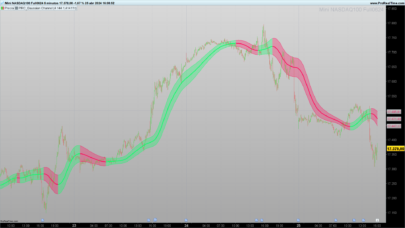
The “EMA Trend Meter” is based on the Exponential Moving Average (EMA), which is a more sensitive version of the moving average that gives more weight to recent data. This indicator uses four EMAs of different periods (1, 7, 14, and 21 days) to detect the direction of the trend and its strength. These periods, as well as the type of averages, are adjustable, as we will see now.
Setup and Parameters
The indicator consists of several adjustable parameters:
- src: Defines the price source, usually the closing price.
- p0, p1, p2, p3: Represent the periods of the EMAs, set at 1, 7, 14, and 21, respectively.
- t0, t1, t2, t3: Types of moving averages, all initially set as exponential averages.
- n: Period used for the calculation of the Rate of Change (ROC).
- Additionally, parameters are incorporated to calculate the RSI and the Stochastic Oscillator, key elements to determine the strength of the trend.
Logic of the Indicator and Calculation
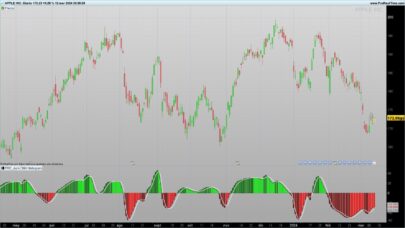
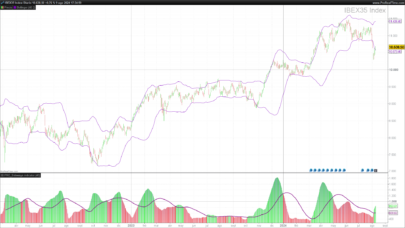
The EMAs are calculated on the selected price, adjusting the indicator’s sensitivity to price changes. The ROC of the EMAs offers a measure of the speed at which the trend changes. By combining the reading of the variation of the EMAs with that of the stochastic RSI, the “EMA Trend Meter” provides a comprehensive view of the direction and strength of trends.
Interpretation of the Indicator
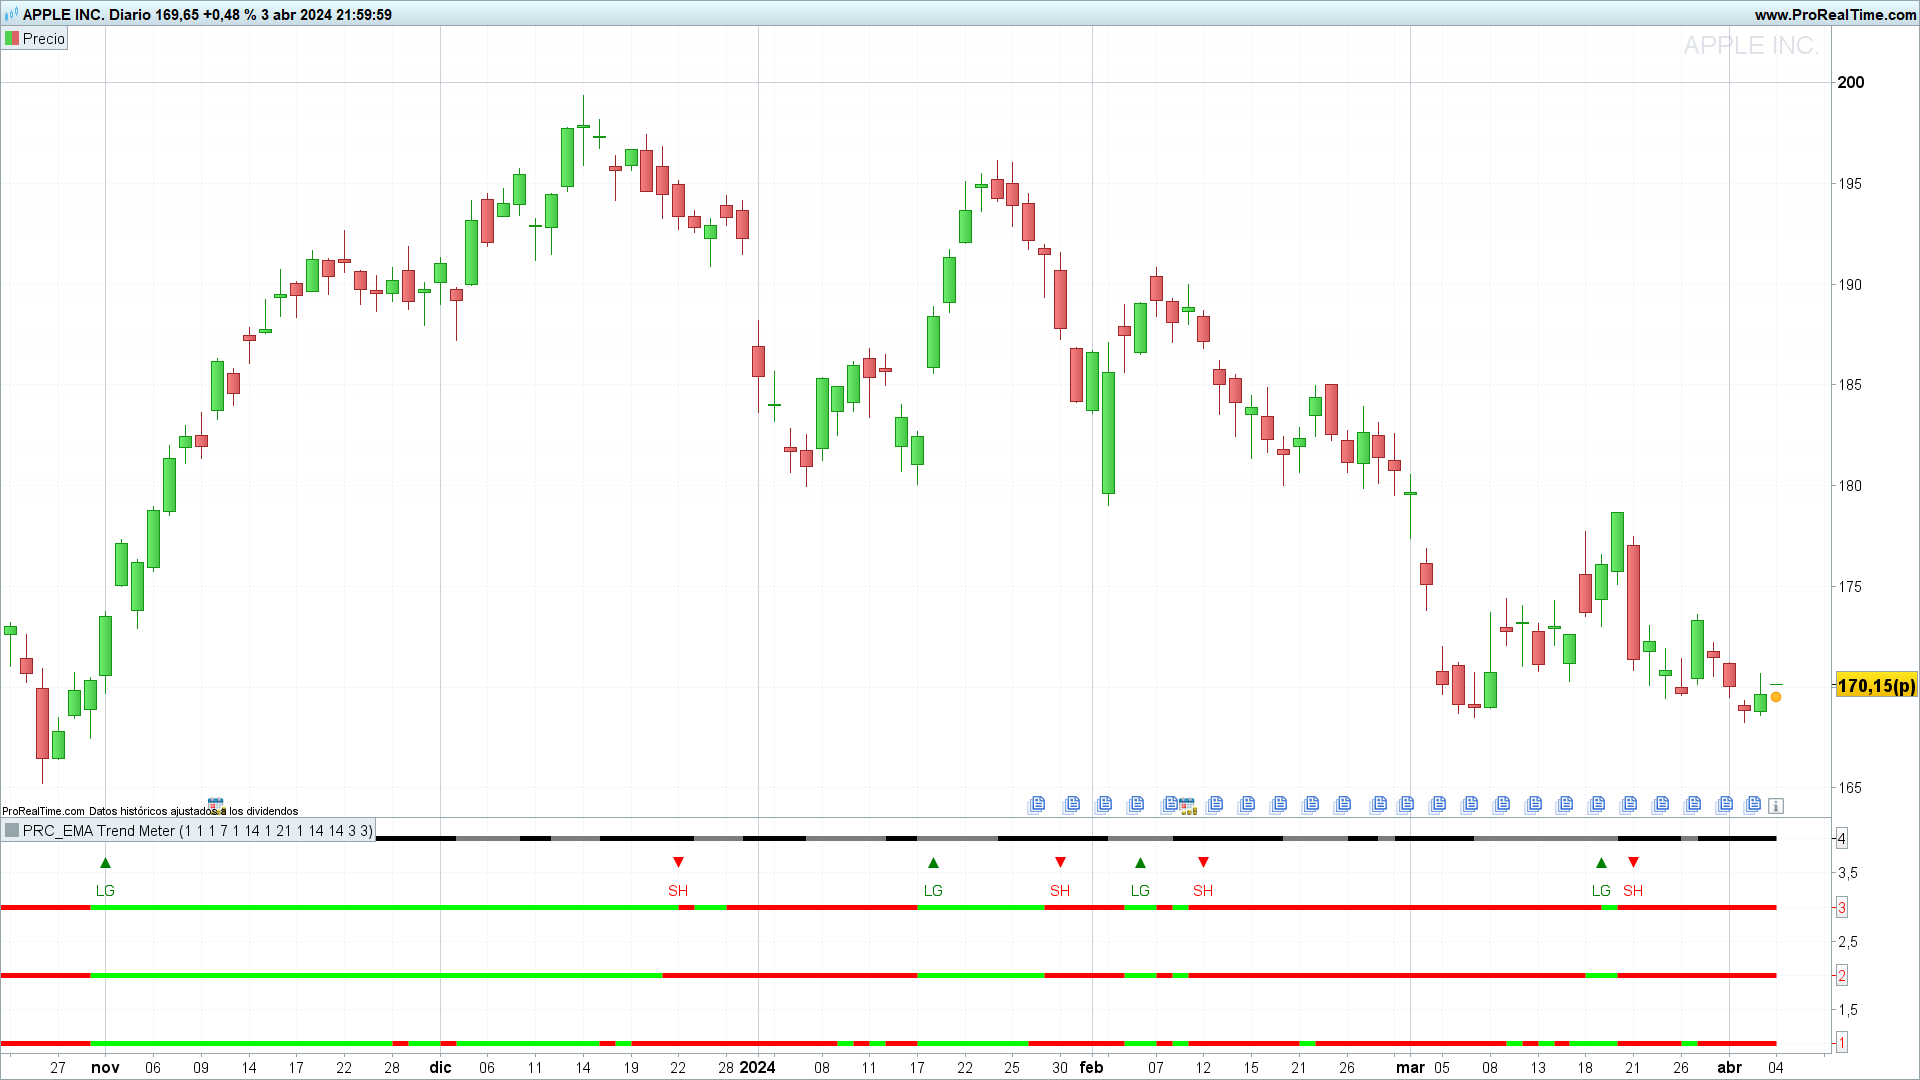
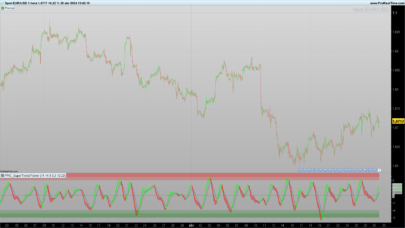
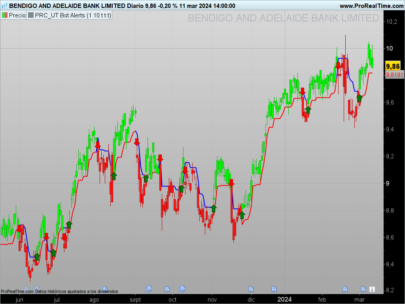
The interpretation focuses on the color of the EMA lines and the relative position of the Stochastic K and D. EMAs that change to green indicate an uptrend, while red suggests a downtrend. A Stochastic K above D reinforces the buy signal, and vice versa for the sell signal.
Trading Alerts
The indicator generates buy alerts when more than one EMA turns green and the Stochastic K is above D. Similarly, sell alerts are generated under opposite conditions. This is a way of combining signals from different indicators.
Conclusion
The “EMA Trend Meter” can be a powerful tool for traders looking to capture and analyze market trends accurately. Its ability to combine multiple indicators on a single chart makes it indispensable for future trading strategies.
Indicator Code in ProBuilder
Below is the code for the indicator in the ProBuilder language, designed to be easily integrated into the ProRealTime platform:
|
1 2 3 4 5 6 7 8 9 10 11 12 13 14 15 16 17 18 19 20 21 22 23 24 25 26 27 28 29 30 31 32 33 34 35 36 37 38 39 40 41 42 43 44 45 46 47 48 49 50 51 52 53 54 55 56 57 58 59 60 61 62 63 64 65 66 67 68 69 70 71 72 73 74 75 76 77 78 79 80 81 82 83 |
//PRC_EMA Trend Meter //version = 0 //04.04.24 //Iván González @ www.prorealcode.com //Sharing ProRealTime knowledge //-----Inputs--------------------------------------------------// src=customclose p0=1//Periods Baseline moving average t0=1//Type of moving average p1=7//Periods moving average 1 t1=1//Type of moving average 1 p2=14//Periods moving average 2 t2=1//Type of moving average 2 p3=21//Periods moving average 3 t3=1//Type of moving average 3 n=1//Periods ROC calculation rsiperiod = 14//RSI periods Stolength = 14//Stochastic Length SmoK=3//K periods SmoD=3//D periods ShowAlerts=1//Show long/short alerts //-------------------------------------------------------------// //-----EMAs Calculations---------------------------------------// ema0 = average[p0,t0](src) ema1 = average[p1,t1](ema0) ema2 = average[p2,t2](ema0) ema3 = average[p3,t3](ema0) rocema1 = roc[n](ema1) rocema2 = roc[n](ema2) rocema3 = roc[n](ema3) //-------------------------------------------------------------// //-----Stochastic RSI Calculations----------------------------------------// myRSI = rsi[rsiperiod](ema0) minRSI = lowest[Stolength](myRSI) maxRSI = highest[Stolength](myRSI) StochRSI = (myRSI-MinRSI) / (MaxRSI-MinRSI) Stok = average[SmoK](StochRSI)*100 StoD = average[SmoD](Stok) //-------------------------------------------------------------// //-----Trend meter configuration-------------------------------// if rocema1>0 then r01=0 g01=255 else r01=255 g01=0 endif if rocema2>0 then r02=0 g02=255 else r02=255 g02=0 endif if rocema3>0 then r03=0 g03=255 else r03=255 g03=0 endif if StoK>StoD then r=124 g=124 b=124 else r=0 g=0 b=0 endif //-------------------------------------------------------------// //-----Alert Conditions----------------------------------------// if ShowAlerts and ((rocema1>0) + (rocema2 > 0) + (rocema3>0))>1 and stoK>StoD and not long then long=1 drawtext("▲",barindex,3.65)coloured("green") drawtext("LG",barindex,3.25)coloured("green") elsif ShowAlerts and ((rocema1>0) + (rocema2 > 0) + (rocema3>0))<2 and stoK<StoD and long then long=0 drawtext("▼",barindex,3.65)coloured("red") drawtext("SH",barindex,3.25)coloured("red") endif //-------------------------------------------------------------// return 1 as "ema1" coloured(r01,g01,0)style(line,5),2 as "ema2" coloured(r02,g02,0)style(line,5),3 as "ema3" coloured(r03,g03,0)style(line,5),4 as "RSI" coloured(r,g,b)style(line,5) |
Share this
No information on this site is investment advice or a solicitation to buy or sell any financial instrument. Past performance is not indicative of future results. Trading may expose you to risk of loss greater than your deposits and is only suitable for experienced investors who have sufficient financial means to bear such risk.
ProRealTime ITF files and other attachments :
Find other exclusive trading pro-tools on ![]()
PRC is also on YouTube, subscribe to our channel for exclusive content and tutorials


Cuando te descargas el fichero itf, en su código no aparece toda la configuración de alertas ¿cómo puedo solucionar eso?
Si lo descargas e importas en tu PRT verás que se han creado las variables para luego configurar el indicador. Estas variables son las líneas 8 a 21 del código.
Hi, Ivan
As always you are doing great coding. The code works on my PRT, however the issue i face is the colour of the lines particularly Stochastic lines which in your screenshot is Black & White. I use black background so i can’t see black line.
I know all your code has pre-defined colours written inside but can we have colour selection menu ? similar to existing PRT indicator where we can select the colour by going into setting and then change to whatever we like?
Nevertheless How do i change this black and white colour you applied in your code to green and red? and what line i need to change in the code?
thanks
You can delete in the last line (return) the configuration for color. Delete coloured(xx,xx,xx) and you will be able to configure after in a new window.
You can also change color directly in code. Check lines after line 40.
If you want change background color you can go to settings in the menu.