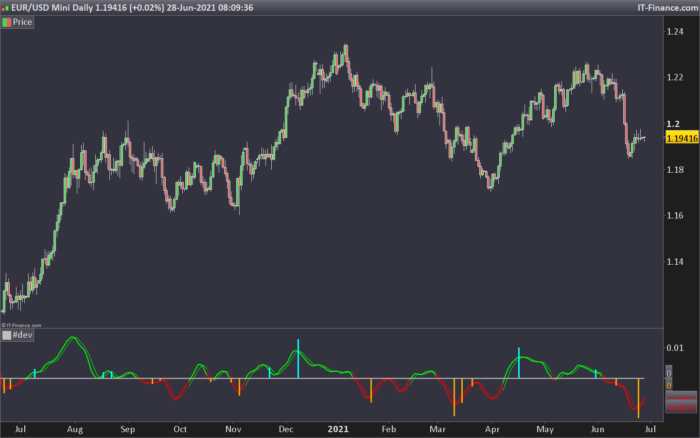
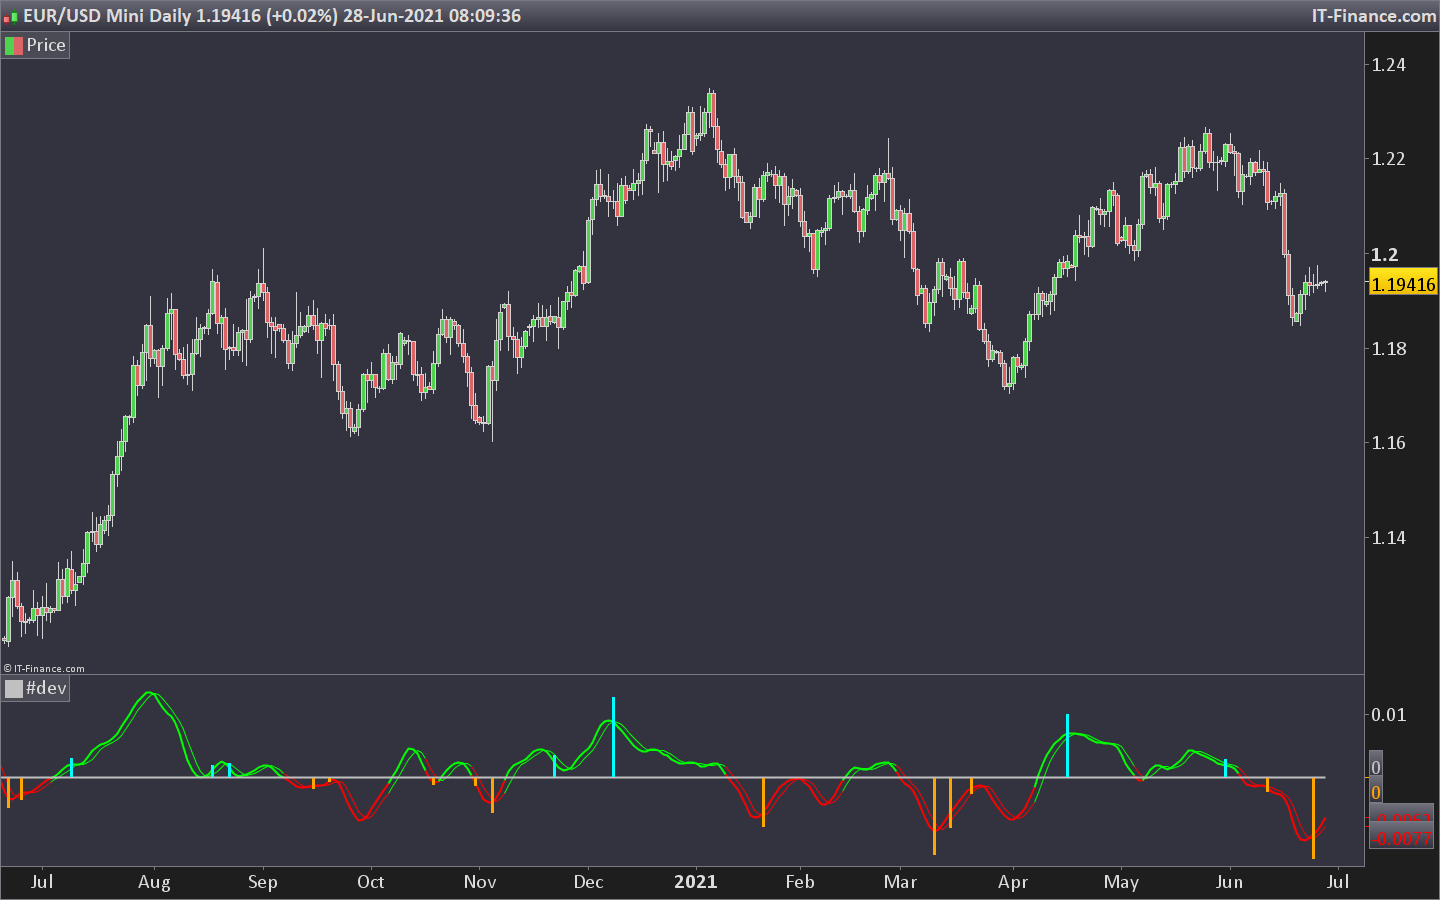
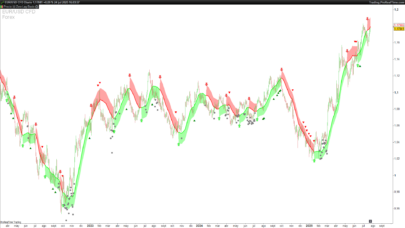
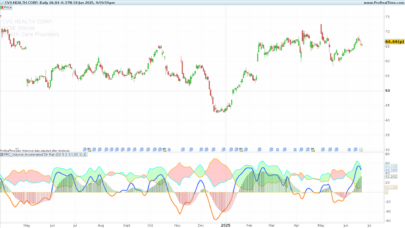
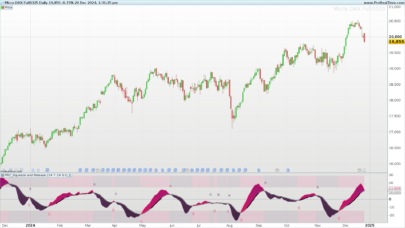
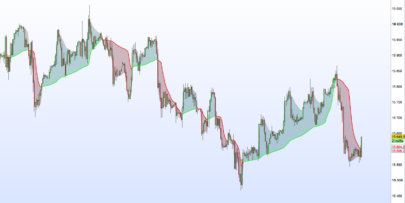
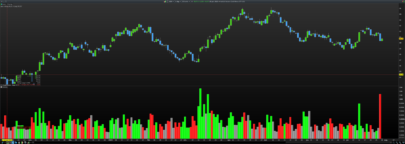
Oscillator from the difference between Ema and Sma around line 0, fairly reactive if you use the crossing of the 2 lines, more conservative if you expect the lines to cross the zero line. Histogram / column for the large change in volume with the cut so that it only shows a large divergence with the mean. colors show trends.
|
1 2 3 4 5 6 7 8 9 10 11 12 13 14 15 16 17 18 19 20 21 22 23 24 25 26 27 28 29 30 31 32 33 34 35 36 37 38 39 |
//PRC_ema-sma vol | indicator //28.06.2021 //Nicolas @ www.prorealcode.com //Sharing ProRealTime knowledge //converted from pinescript // --- settings length = 9 //input(9, minval=1, title="short ema") lensma = 17 //input(17, title="long sma") // --- end of settings vol = volume src=close vm = 100 * ((average[length](vol) - average[length](vol)[4]) / average[length](vol)[4]) vvm = 100 * average[3]((vm - vm[1]) / vm[1]) osc = average[3](exponentialaverage[length](src) - average[lensma](src)) sig = (osc + 2 * osc[1] + 2 * osc[2] + osc[3]) / 6 if osc>0 then r=0 g=255 else r=255 g=0 endif if abs(vvm / 8) > abs(average[5](vvm)) then cut=osc/.7 else cut=0 endif if cut>0 then r1=0 g1=255 b1=255 else r1=255 g1=165 b1=0 endif return sig coloured(r,g,0) as "Sig", osc coloured(r,g,0) style(line,2) as "ROC", 0 style(line,2) as "zero line", cut coloured(r1,g1,b1) style(histogram) |
Share this
No information on this site is investment advice or a solicitation to buy or sell any financial instrument. Past performance is not indicative of future results. Trading may expose you to risk of loss greater than your deposits and is only suitable for experienced investors who have sufficient financial means to bear such risk.
ProRealTime ITF files and other attachments :
Find other exclusive trading pro-tools on ![]()
PRC is also on YouTube, subscribe to our channel for exclusive content and tutorials


Bonjour Nicolas, j’ai récemment découvert cet indicateur (Regularized Momentum 2017) et je le trouve très intéressant, mais je voulais vous demander, quelle ligne du code dois-je modifier pour que les résultats numériques des quatre lignes qui composent le graphique apparaissent avec plus de cinq décimales places, par exemple avec sept ( 0,00000012)
Merci
Bonjour, nouveau sur PRT (qq jours), j’essaie un peu de voir quel type d’indicateur me conviendrait et je vais voir si celui-ci peut m’aider. Merci pour votre aide et vos nombreux posts très utiles pour les amateurs comme moi. Bien cordialement