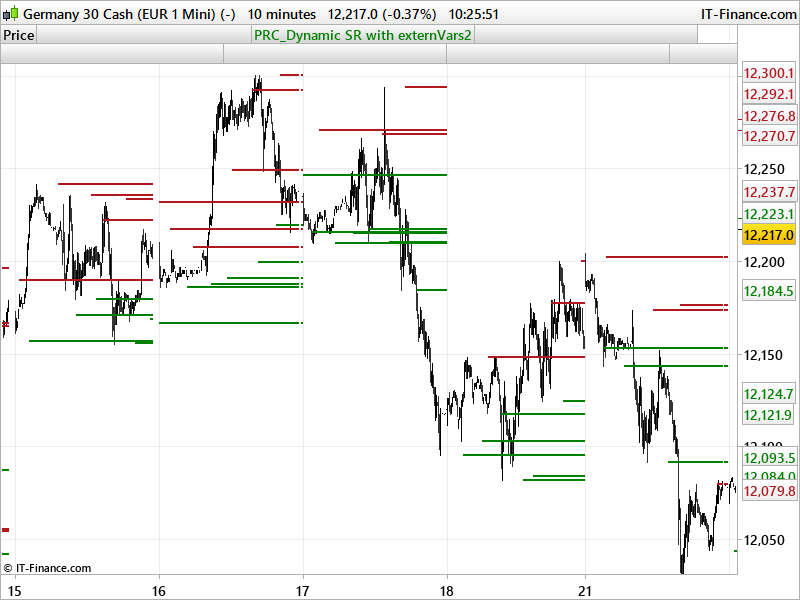
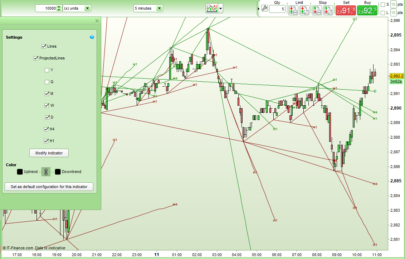
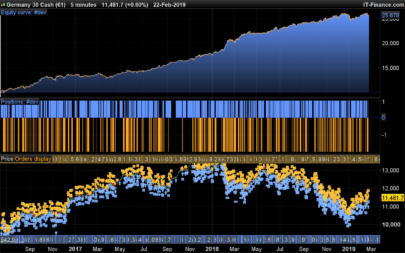
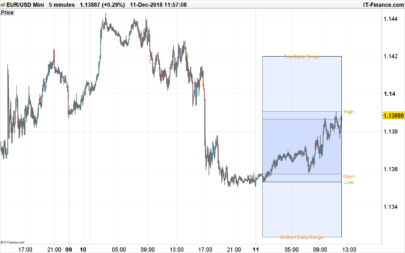
Intraday supports and resistances plotted on your chart! This indicator will fetch the whole intraday price values to find relevant support and resistance zones for you. “only” 10 support and resistances lines will be plotted.
These lines are reset each day to make them appearing once new support or resistance are found.
The 20 values (10 resistances and 10 supports) are returned and could be used with any automatic trading program
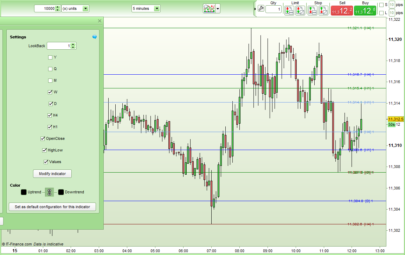
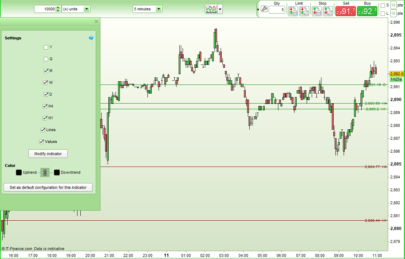
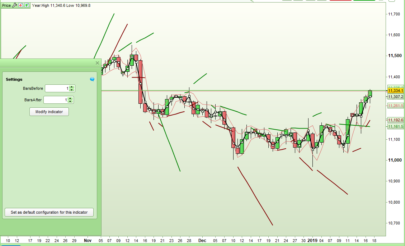
Settings:
n = periods to find highest high and lowest low for new support / resistance comparing
tolerance = value in point to expand or narrow the old support / resistance value with the new found ones
lookback = period lookback to confirm support and resistance areas
showSupport = true or false
showResistance = true of false
Original code and idea from @Rorschack from this topic: https://www.prorealcode.com/topic/swing-lines-indicator/
|
1 2 3 4 5 6 7 8 9 10 11 12 13 14 15 16 17 18 19 20 21 22 23 24 25 26 27 28 29 30 31 32 33 34 35 36 37 38 39 40 41 42 43 44 45 46 47 48 49 50 51 52 53 54 55 56 57 58 59 60 61 62 63 64 65 66 67 68 69 70 71 72 73 74 75 76 77 78 79 80 81 82 83 84 85 86 87 88 89 90 91 92 93 94 95 96 97 98 99 100 101 102 103 104 105 106 107 108 109 110 111 112 113 114 115 116 117 118 119 120 121 122 123 124 125 126 127 128 129 130 131 132 133 134 135 136 137 138 139 140 141 142 143 144 145 146 147 148 149 150 151 152 153 154 155 156 157 158 159 160 161 162 163 164 165 166 167 168 169 170 171 172 173 174 175 176 177 178 179 180 181 182 183 184 185 186 187 188 189 190 191 192 193 194 195 196 197 198 199 200 201 202 203 204 205 206 207 208 209 210 211 212 213 214 215 216 217 218 219 220 221 222 223 224 225 226 227 |
//PRC_Dynamic intraday SR | indicator //23.08.2017 //Nicolas @ www.prorealcode.com //Sharing ProRealTime knowledge // --- settings //n = 20 // highest and lowest period for support/resistance fetch //tolerance = 5 // should be expressed in points) if there are two (or more) lines that are close to me, then you have to draw a center line //lookback = 10 // period lookback to confirm support and resistance areas //showSupport = 1//(0=false , 1=true) //showResistance = 1 //(0=false , 1=true) // --- end of settings maxbars=intradaybarindex once linear = 0 once lineas = 0 once newlinear = 0 once newlineas = 0 once newlinearr = 0 once newlineass = 0 if showResistance then resistance = highest[n](high) if resistance[n-lookback] = resistance[1] then linear = (resistance[1] + linear) / 2 else linear = linear endif if linear[2] = linear[1] and linear[1] = linear then newlinear = linear endif i = 0 valsup = newlinear + tolerance*pointsize valinf = newlinear - tolerance*pointsize while i <> maxbars do if newlinear[i] = 0 then break endif cond = (newlinear[i] <= valsup and newlinear[i] >= valinf) or (newlineas[i] <= valsup and newlineas[i] >= valinf) if cond then newlinearr = (newlinear[i] + newlinear)/2 endif i = i+1 wend if intradaybarindex=0 then resistancecount = 1 alphar1 = 0 alphar2 = 0 alphar3 = 0 alphar4 = 0 alphar5 = 0 alphar6 = 0 alphar7 = 0 alphar8 = 0 alphar9 = 0 alphar10 = 0 endif //store last 10 found resistance once resistancecount=1 if newlinearr<>lastresistance then resistancecount=resistancecount+1 if resistancecount=1 then resistance1=newlinearr lastresistance=resistance1 alphar1 = 255 endif if resistancecount=2 then resistance2=newlinearr lastresistance=resistance2 alphar2 = 255 endif if resistancecount=3 then resistance3=newlinearr lastresistance=resistance3 alphar3 = 255 endif if resistancecount=4 then resistance4=newlinearr lastresistance=resistance4 alphar4 = 255 endif if resistancecount=5 then resistance5=newlinearr lastresistance=resistance5 alphar5 = 255 endif if resistancecount=6 then resistance6=newlinearr lastresistance=resistance6 alphar6 = 255 endif if resistancecount=7 then resistance7=newlinearr lastresistance=resistance7 alphar7 = 255 endif if resistancecount=8 then resistance8=newlinearr lastresistance=resistance8 alphar8 = 255 endif if resistancecount=9 then resistance9=newlinearr lastresistance=resistance9 alphar9 = 255 endif if resistancecount=10 then resistance10=newlinearr lastresistance=resistance10 alphar10 = 255 endif if resistancecount=10 then resistancecount=0 endif endif endif if showSupport then support = lowest[n](low) if support[n-lookback] = support[1] then lineas = (support[1] + lineas) / 2 else lineas = lineas endif if lineas[2] = lineas[1] and lineas[1] = lineas then newlineas = lineas endif i = 0 valsup = newlineas + tolerance*pointsize valinf = newlineas - tolerance*pointsize while i <> maxbars do if newlineas[i] = 0 then break endif cond = (newlineas[i] <= valsup and newlineas[i] >= valinf) or (newlinear[i] <= valsup and newlinear[i] >= valinf) if cond then newlineass = (newlineas[i] + newlineas)/2 endif i = i+1 wend if intradaybarindex=0 then supportcount = 1 alphas1 = 0 alphas2 = 0 alphas3 = 0 alphas4 = 0 alphas5 = 0 alphas6 = 0 alphas7 = 0 alphas8 = 0 alphas9 = 0 alphas10 = 0 endif //store last 10 found support once supportcount=1 if newlineass<>lastsupport then supportcount=supportcount+1 if supportcount=1 then support1=newlineass lastsupport=support1 alphas1 = 255 endif if supportcount=2 then support2=newlineass lastsupport=support2 alphas2 = 255 endif if supportcount=3 then support3=newlineass lastsupport=support3 alphas3 = 255 endif if supportcount=4 then support4=newlineass lastsupport=support4 alphas4 = 255 endif if supportcount=5 then support5=newlineass lastsupport=support5 alphas5 = 255 endif if supportcount=6 then support6=newlineass lastsupport=support6 alphas6 = 255 endif if supportcount=7 then support7=newlineass lastsupport=support7 alphas7 = 255 endif if supportcount=8 then support8=newlineass lastsupport=support8 alphas8 = 255 endif if supportcount=9 then support9=newlineass lastsupport=support9 alphas9 = 255 endif if supportcount=10 then support10=newlineass lastsupport=support10 alphas10 = 255 endif if supportcount=10 then supportcount=0 endif endif endif RETURN support1 coloured(0,128,0,alphas1) style(point,2),support2 coloured(0,128,0,alphas2)style(point,2),support3 coloured(0,128,0,alphas3)style(point,2),support4 coloured(0,128,0,alphas4)style(point,2),support5 coloured(0,128,0,alphas5)style(point,2),support6 coloured(0,128,0,alphas6)style(point,2),support7 coloured(0,128,0,alphas7)style(point,2),support8 coloured(0,128,0,alphas8)style(point,2),support9 coloured(0,128,0,alphas9)style(point,2),support10 coloured(0,128,0,alphas10)style(point,2),resistance1 coloured(176,23,31,alphar1) style(point,2),resistance2 coloured(176,23,31,alphar2)style(point,2),resistance3 coloured(176,23,31,alphar3)style(point,2),resistance4 coloured(176,23,31,alphar4)style(point,2),resistance5 coloured(176,23,31,alphar5)style(point,2),resistance6 coloured(176,23,31,alphar6)style(point,2),resistance7 coloured(176,23,31,alphar7)style(point,2),resistance8 coloured(176,23,31,alphar8)style(point,2),resistance9 coloured(176,23,31,alphar9)style(point,2),resistance10 coloured(176,23,31,alphar10)style(point,2) |
original code and idea from @Rorschack in this topic:
https://www.prorealcode.com/topic/swing-lines-indicator/
Share this
No information on this site is investment advice or a solicitation to buy or sell any financial instrument. Past performance is not indicative of future results. Trading may expose you to risk of loss greater than your deposits and is only suitable for experienced investors who have sufficient financial means to bear such risk.
ProRealTime ITF files and other attachments :
Find other exclusive trading pro-tools on ![]()
PRC is also on YouTube, subscribe to our channel for exclusive content and tutorials


si vedono i puntini e basso
come mai?
grazie
Looks excellent. Can’t wait to experiment with it!
Hi Nicolas,
Thanks for this. Looks interresting.
Unfortunately the display on my price graph is not readable. Looks like some S/R=0 so that the vertical scale starts from 0 (to 12 350 on DAX)… so that I cannot see anything…
Any idea from where the issue might come ? (I tried with 25 units, 50 units, 1 000 units display… but the issue remains the same).
Thanks again and in advance for your “support” 😉
Use vertical axis alignment only in indicators setting
Nicolas ( or anyone) would you know how to program a ‘WAIT’. In other words, in auto trading when this indicator above appears I want to wait until my DEMA has changed direction as well.
Any idea how to write code to ‘wait’ for X or Y to happen before buying or selling. Appreciate in advance any help
Con time frame daily funzionerebbe correttamente? per multiday
con tf daily funzionerebbe per Mday???
Questo indicatore è stato progettato solo per i dati intraday, ma potrebbe essere adattato ad altre unità di tempo maggiori o uguali a Giornaliero. Se necessario, si prega di creare un argomento nel forum per fare questa richiesta.
//FR
Bonjour,
Dans le code ci dessus, je ne comprends pas ce que fait la ligne : linear = (resistance[1] + linear) / 2
Ni celle de la condition : newlineass = (newlineas[i] + newlineas)/2
Auriez vous quelques explications s’il vous plait ?
//Eng
Hello,
Within the above code, what does the lines :
-linear = (resistance[1] + linear) / 2
– newlineass = (newlineas[i] + newlineas)/2
Do, please?
Thank you,
J’ai déjà répondu à cette question quelque part sur le forum. Il faudrait chercher un topic sur le sujet de cet indicateur. Désolé je ne peux pas pour le moment