
I still debate myself between indicators that try to predict the future and those that illustrate a simplified view of the obvious market moves. I think that indicators that are very clear help in 2 ways: 1) indicating trades that are conceptually simple, that everybody understands and where you visualise your edge and 2) not forgetting to look at the basics.
This indicator won’t predict any future: it aims to put in a clear way what the market does, and it is conceptually very simple.
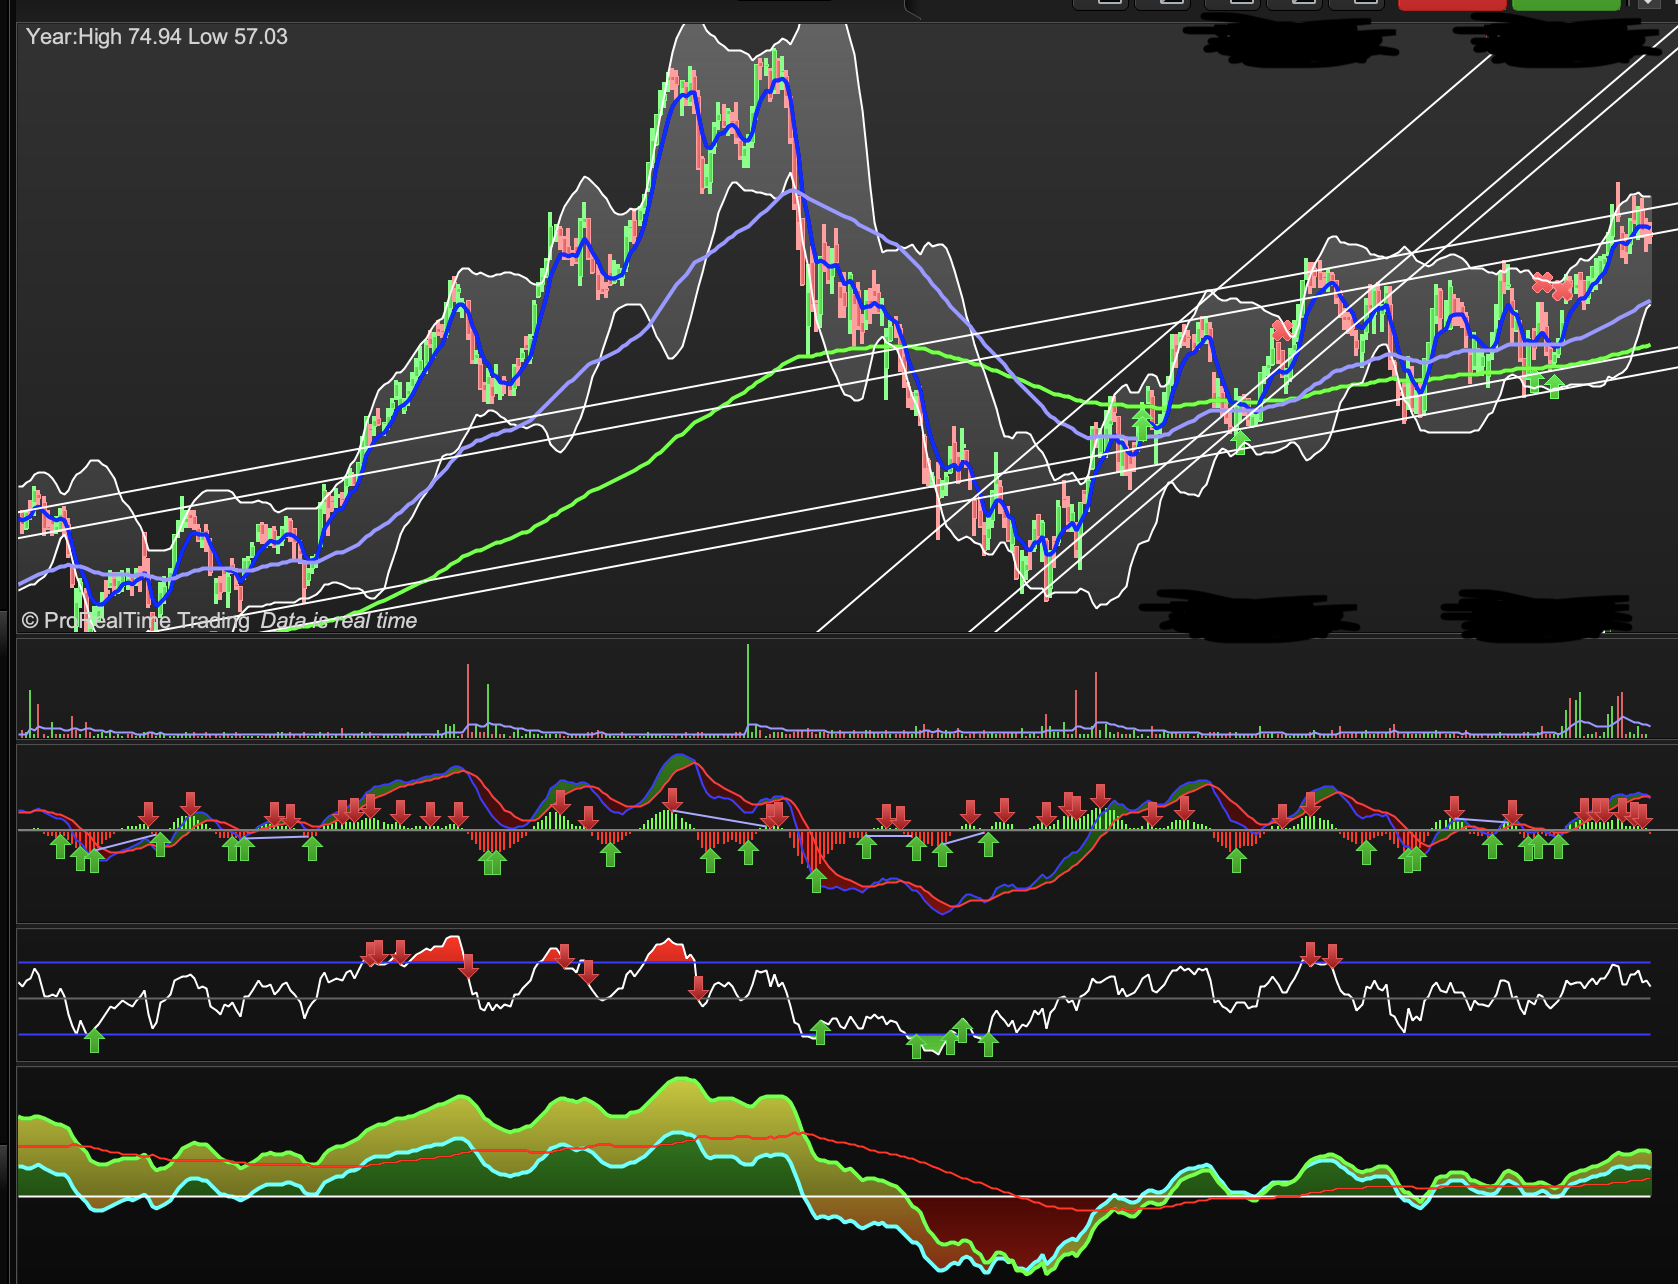
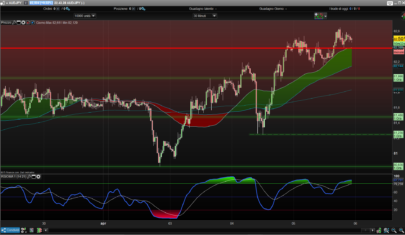
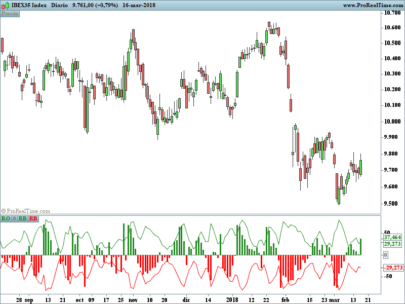
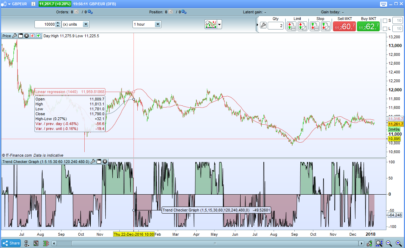
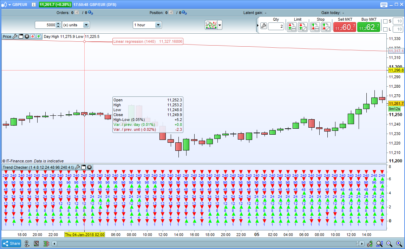
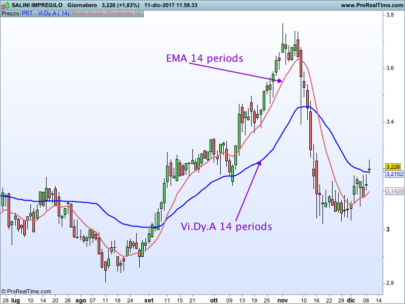
I use it for trend following. It measures the distances between price (smooth version of price) and moving averages (exponential, default of 70 and 200 as I use for Spanish stocks). The behaviour that I look for are bounces with (or close to) the 0 line. Interpretation: a bounce in the 0 line simply is the moving average acting as a support (if the bounce is a local minima) or resistance (if the bounce is a local maxima).
I use a smoothed version of the price (exp moving average, default 15) for 2 reasons: 1) close price on itself it gives too spiky signals that become more complex to interpret, 2) it is very common for price to pierce a moving average, but it is far less likely that a smooth version of close (i.e. another moving average) pierces it.
Finally, I print (red line) the distance between the 2 moving averages (70 and 200). This is simply to bring in the longer term trend (bull > 0, bear < 0) as well as MA crossings.
You may likely see this as a redundant indicator if you print your moving averages in the chart, and you will be right. This is just a way to bring moving average interpretation to a simplified form.
I hope someone finds it useful. Any feedback or comments are welcome!
|
1 2 3 4 5 6 7 8 9 10 11 12 13 14 15 16 17 18 19 20 21 22 23 24 25 26 27 28 29 30 31 32 33 34 35 36 37 38 39 40 41 42 43 44 45 46 47 48 49 50 51 52 53 54 55 56 57 58 59 |
// By camporan // last updated: 20/07/19 // This indicator is a stacked indicator, handy to flatten the moving averages (default are 70 and 200). Areas of interest: when any of the 2 stacked lines approaches 0: very often they tend to bounce in (or close to) the 0 mark. // Interpretation: very simple: if the indicators bounce close to 0 it shows that the moving average acts as support or resistence for the price. // Often price itself may pierce the moving average, but a smoothed close (exponenital moving average) is significantly more precise bouncing. //settings DisplaySignals=1 m=70 m2=200 smoothFactor=15 //end of settings // SECURITY CONTROLS :) IF m < 1 THEN m = 1 ENDIF IF m2 < 1 THEN m2 = 1 ENDIF IF smoothFactor < 1 THEN smoothFactor = 1 ENDIF media = ExponentialAverage[m](close) media2 = ExponentialAverage[m2](close) smoothClose = ExponentialAverage[smoothFactor](close) distance = 100*(smoothClose-media)/close distance2 = 100*(smoothClose-media2)/close // Z-Score normalization could be useful if we compute the rolling STD in a long enough period //Z = (smoothClose-media)/STD[m](close) //distance = distance/STD[m](smoothClose) ismin = distance > distance[1] AND distance[1] < distance[2] ismax = distance < distance[1] AND distance[1] > distance[2] if ismin AND DisplaySignals THEN drawarrowup(barindex,distance) coloured(30, 160,30) ENDIF if ismax AND DisplaySignals THEN drawarrowdown(barindex,distance) coloured(160,30,30) ENDIF ismin2 = distance2 > distance2[1] AND distance2[1] < distance2[2] ismax2 = distance2 < distance2[1] AND distance2[1] > distance2[2] if ismin2 AND DisplaySignals THEN drawarrowup(barindex,distance2) coloured(30, 160,30) ENDIF if ismax2 AND DisplaySignals THEN drawarrowdown(barindex,distance2) coloured(160,30,30) ENDIF // Estos 2 calculos de largas son los mismos. Usamos el 2do porque ya tenemos parte calculada (i.e. mejor performance) //largas = media-media2 //largas = 100 * largas / close largas = distance2 - distance return distance as "distance", distance2 as "distance2", 0 as "cero", largas as "largas" |
Share this
No information on this site is investment advice or a solicitation to buy or sell any financial instrument. Past performance is not indicative of future results. Trading may expose you to risk of loss greater than your deposits and is only suitable for experienced investors who have sufficient financial means to bear such risk.
ProRealTime ITF files and other attachments :
Find other exclusive trading pro-tools on ![]()
PRC is also on YouTube, subscribe to our channel for exclusive content and tutorials


hello ,
Thanks for this indicatior , what timeframe do you use it on ?
You can use it 5M onwards, but the longer timeframe the more accurate it is. My preferred are 30M and daily. Also, use your judgement to see if the bounces do happen historically: the edge is just likelihood, and the best way to know how good your edge is, is by looking at the past 🙂
can we have it in mql4 platform? or how or which platform do we use it?
I don’t use MetaTrader so I won’t be able to do the translation myself. Sorry!
This can for amibroker ? . Thanks