This indicator is a further adaptation of the DOWAR – Day Of Week Average Range indicator that can be found here:
https://www.prorealcode.com/prorealtime-indicators/dowar-day-of-week-average-range-bands/
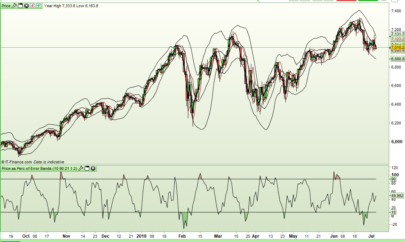
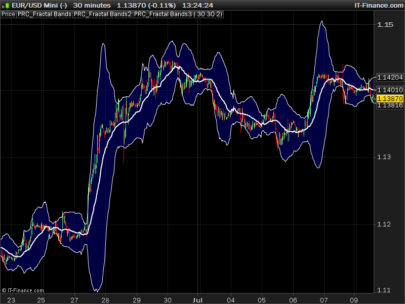
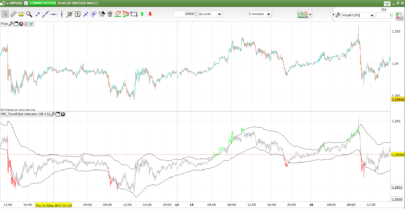
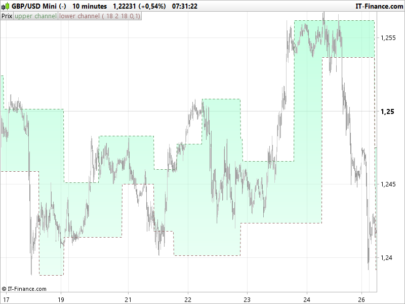
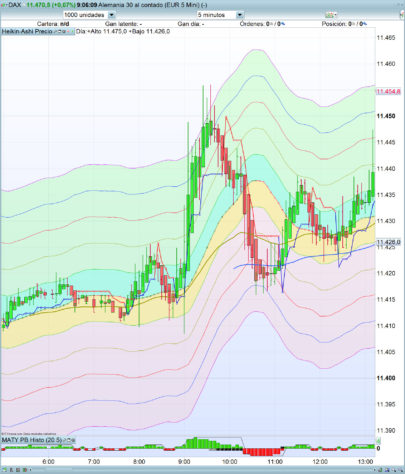
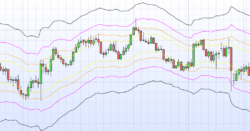
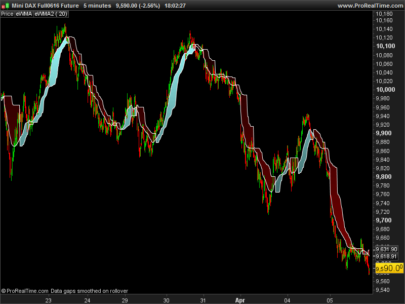
This new version is not just limited to use on the daily chart but can be used on any chart time frame – daily or faster – so now it is possible to see day of week average range bands on a 5 minute chart for example. This new version also has a mid line in addition to the upper and lower levels.
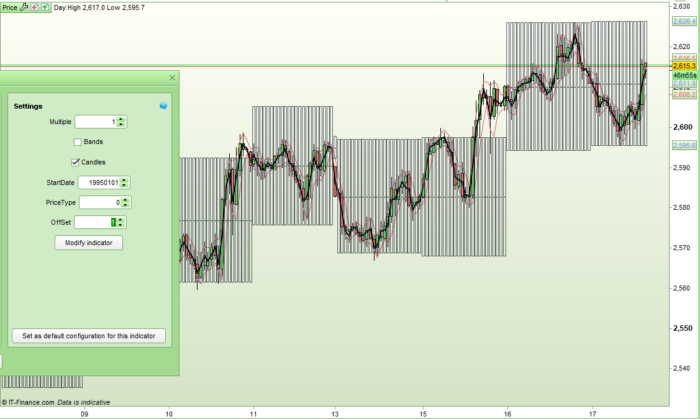
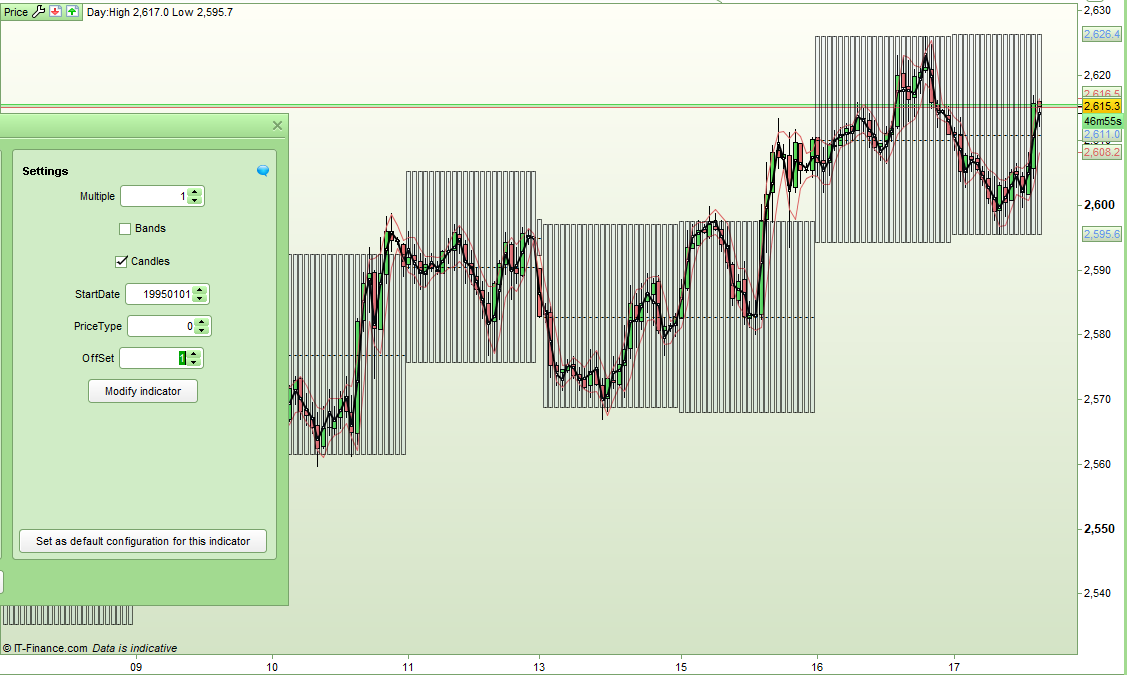
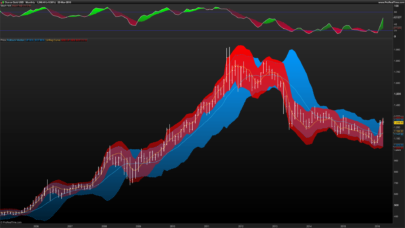
The indicator calculates an all time average range for each day of the week and then applies it to the chart as bands or a background candle or both. So for example on Monday candles the bands (or background candle) will represent the all time average range for all recorded Mondays in history up to that date.
The bands/candles can be made wider or narrower by adjusting the ‘Multiple’ setting.
The centre of the bands can be based on any custom close such as median price, close, typical price, total price etc. Choose your price type by changing the PriceType setting:
0 = close
1 = median price
2 = total price
3 = typical price
4 = weighted close
By adjusting the offset you can decide which day the bands/candles will be centred on. 0 = todays, 1 = yesterdays.
You can set the start date from when the indicator should start calculating the daily averages. Set StartDate to zero if you want to use all available history.
I recommend that you download the itf file and import it to get full functionality rather than cut and pasting the code.
|
1 2 3 4 5 6 7 8 9 10 11 12 13 14 15 16 17 18 19 20 21 22 23 24 25 26 27 28 29 30 31 32 33 34 35 36 37 38 39 40 41 42 43 44 45 46 47 48 49 50 51 52 53 54 55 56 57 58 59 60 61 62 63 64 65 66 67 68 69 70 71 72 73 74 75 76 77 78 79 80 81 82 83 84 85 86 87 88 89 90 91 92 93 94 95 96 97 98 99 100 101 102 103 104 105 106 107 108 109 110 111 112 113 114 115 116 117 118 119 120 121 122 123 124 125 126 127 128 129 130 131 132 133 134 135 |
//DOWAROAC Bands - Day Of Week Average Range (On Any Chart) Bands //By Vonasi //20190117 //Multiple = 1 //Offset = 1 //Bands = 0 //Candles = 1 //StartDate = 0 if opendate >= StartDate or startdate = 0 then if opendayofweek[0] <> opendayofweek[1] then rnge = (dHigh(1) - dLow(1)) //close if offset = 1 then if pricetype < 1 or pricetype > 4 then start = close[1] endif //medianprice if pricetype = 1 then start = ((rnge)/2) + dlow(1) endif //totalprice if pricetype = 2 then start = (dopen(1) + close[1] + dHigh(1) + dLow(1))/4 endif //typicalprice if pricetype = 3 then start = (close[1] + dHigh(1) + dLow(1))/3 endif //weightedprice if pricetype = 4 then start = ((2*close[1]) + dHigh(1) + dLow(1))/4 endif endif if opendayofweek[1] = 0 THEN W0 = (W0 + (rnge)) W0Count = (W0Count + 1) endif IF opendayofweek[1] = 1 THEN W1 = (W1 + (rnge)) W1Count = (W1Count + 1) endif IF opendayofweek[1] = 2 THEN W2 = (W2 + (rnge)) W2Count = (W2Count + 1) endif IF opendayofweek[1] = 3 THEN W3 = (W3 + (rnge)) W3Count = (W3Count + 1) endif IF opendayofweek[1] = 4 THEN W4 = (W4 + (rnge)) W4Count = (W4Count + 1) endif IF opendayofweek[1] = 5 THEN W5 = (W5 + (rnge)) W5Count = (W5Count + 1) endif if opendayofweek = 0 then ThisDay = (W0 / W0Count) endif if opendayofweek = 1 then ThisDay = (W1 / W1Count) endif if opendayofweek = 2 then ThisDay = (W2 / W2Count) endif if opendayofweek = 3 then ThisDay = (W3 / W3Count) endif if opendayofweek = 4 then ThisDay = (W4 / W4Count) endif if opendayofweek = 5 then ThisDay = (W5 / W5Count) endif endif if offset <> 1 then if pricetype < 1 or pricetype > 4 then start = close[1] endif //medianprice if pricetype = 1 then start = ((dhigh(0) - dlow(0))/2) + dlow(0) endif //totalprice if pricetype = 2 then start = (dopen(0) + close[0] + dHigh(0) + dLow(0))/4 endif //typicalprice if pricetype = 3 then start = (close[0] + dHigh(0) + dLow(0))/3 endif //weightedprice if pricetype = 4 then start = ((2*close[0]) + dHigh(0) + dLow(0))/4 endif endif upper = start + ((ThisDay * multiple)/2) lower = start - ((ThisDay * multiple)/2) middle = ((upper -lower)/2) + lower if candles then drawcandle(lower,upper,lower,upper) COLOURED(100,149,237,20) BORDERCOLOR(0,0,0,150) drawtext("-",barindex,middle) COLOURED(0,0,0) endif c = 0 if bands then c = 255 endif else upper = close lower = close middle = close c = 0 endif RETURN upper coloured (100,149,237,c) style(line, 1) as "Upper Band", lower coloured (100,149,237,c) style(line, 1) as "Lower Band", middle coloured (100,149,237,c) style(line, 1) as "Middle Band" |
Share this
No information on this site is investment advice or a solicitation to buy or sell any financial instrument. Past performance is not indicative of future results. Trading may expose you to risk of loss greater than your deposits and is only suitable for experienced investors who have sufficient financial means to bear such risk.
ProRealTime ITF files and other attachments :
Find other exclusive trading pro-tools on ![]()
PRC is also on YouTube, subscribe to our channel for exclusive content and tutorials
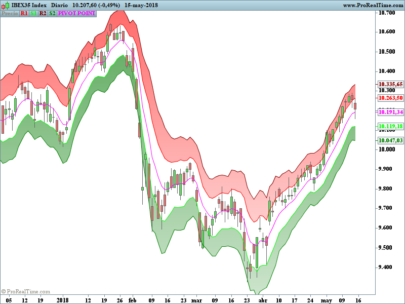

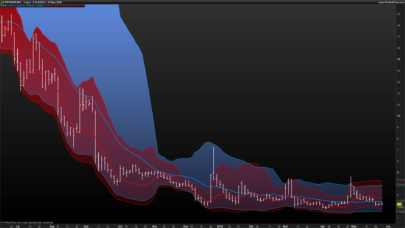


A modified version of this indicator can be found here:
https://www.prorealcode.com/topic/most-active-months-range-v2/#post-89161
This version can also calculate the average range for each day as a percentage of the opening price and then draw bands based on this value.