1. Introduction
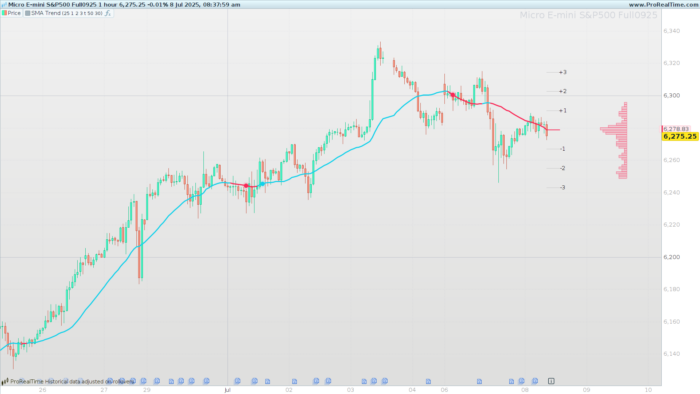
The Deviation Trend Profile indicator, developed by BigBeluga, merges trend analysis via a simple moving average (SMA) with a distribution profile based on ATR-scaled deviations. Its purpose is to highlight trend changes and zones of high or low price concentration, offering a visual map of volatility accumulation since the last market inflection.
2. What Is Deviation Trend Profile?
Deviation Trend Profile is a dual-purpose tool:
-
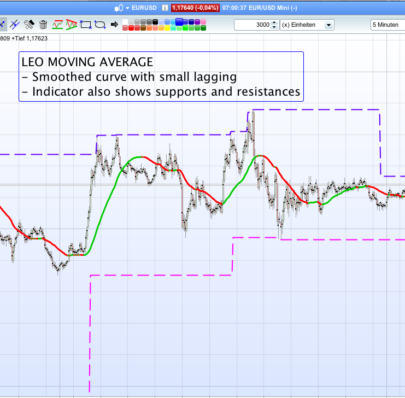
Trend: Plots an SMA whose color reflects momentum, and marks the exact bars where bullish or bearish turns begin.
-
Volatility & Distribution: Overlays six deviation lines (±1, ±2, ±3 ATR multiples) around the SMA, and generates a side histogram showing how many closes have fallen into each of a configurable number of bins between the maximum and minimum deviation levels.
This hybrid approach makes it easy to see when price deviates significantly from its mean and how those deviations are distributed over time.
3. How It Works
3.1. Calculation of SMA and ATR
-
SMA: Simple moving average of closes over a user-set period (
smaLength, default 50). -
ATR: 200-bar Average True Range, serving as the volatility baseline for scaling deviations.
3.2. Standard Deviation Levels
Six horizontal lines are drawn around the SMA:
-
Positive levels:
-
+1 = SMA + ATR × mult1
-
+2 = SMA + ATR × mult2
-
+3 = SMA + ATR × mult3
-
-
Negative levels:
-
–1 = SMA – ATR × mult1
-
–2 = SMA – ATR × mult2
-
–3 = SMA – ATR × mult3
-
These lines help distinguish “normal” price territory (±1 ATR) from stronger expansion zones (±2 and ±3 ATR).
3.3. Trend Change Detection
The indicator computes a normalized momentum:
A cross above +0.1 signals the start of a bullish trend; a cross below –0.1 signals the start of a bearish trend.
Each turn is marked with a point on the SMA.
4. Deep Dive into the Distribution Profile (Histogram)
This advanced feature works as follows:
-
Initialize bins
Create an array$binof lengthbins(default 50), filled with zeros. -
Populate bins with closes
For each bar since the last trend change (startIndex):-
Compute the dynamic range:
profileRange = maxDev − minDev. -
Compute each bin’s width:
step = profileRange / bins. -
Determine which bin a close
cfalls into by comparing it againstlower = minDev + step × iandupper = lower + step, then increment$bin[i].
-
-
Determine color scaling
FindmaxVal, the highest frequency among all bins. This value is used to set each rectangle’s transparency proportionally (val / maxVal). -
Draw rectangles
-
Position the histogram to the right by
profileOffsetbars. -
For each bin with
val > 0, draw a rectangle fromupperdown tolower, with width proportional toval, filled semi-transparently in the current trend color.
-
The result is a lateral histogram showing price-close concentration since the last turn, highlighting potential dynamic support/resistance zones.
5. Parameter Configuration
| Parameter | Description | Default |
|---|---|---|
smaLength |
Period of the simple moving average | 50 |
mult1 |
ATR multiplier for ±1 deviation | 1 |
mult2 |
ATR multiplier for ±2 deviation | 2 |
mult3 |
ATR multiplier for ±3 deviation | 3 |
showTp |
Show distribution profile (1 = yes, 0 = no) | 1 |
bins |
Number of histogram bins | 50 |
profileOffset |
Horizontal offset (bars) for the histogram | 30 |
colUpR/G/B |
RGB channels for bullish trend color | 18/209/235 |
colDnR/G/B |
RGB channels for bearish trend color | 250/40/86 |
6. Default Values and Recommendations
-
SMA (50) & ATR (200): a balanced medium-term setting.
-
Deviations 1–3: distinguish consolidation (±1) from strong expansions (±2, ±3).
-
Bins (50): balance detail and performance; reduce to 30–40 for faster charts, or increase to 70–100 for finer analysis.
-
Offset (30 bars): keeps the profile clear of price action; adjust to fit your chart width.
-
Colors: customize to match your template, ensuring good contrast against candles and other studies.
7. ProBuilder Code
|
1 2 3 4 5 6 7 8 9 10 11 12 13 14 15 16 17 18 19 20 21 22 23 24 25 26 27 28 29 30 31 32 33 34 35 36 37 38 39 40 41 42 43 44 45 46 47 48 49 50 51 52 53 54 55 56 57 58 59 60 61 62 63 64 65 66 67 68 69 70 71 72 73 74 75 76 77 78 79 80 81 82 83 84 85 86 87 88 89 90 91 92 93 94 95 96 97 98 99 100 101 102 103 104 105 106 107 108 109 110 111 112 113 114 115 116 117 118 119 120 121 122 123 124 125 126 127 128 129 130 131 132 133 134 135 136 137 138 139 140 141 142 143 144 145 146 147 148 149 150 151 152 153 154 155 156 157 158 159 160 161 162 163 164 165 166 167 168 169 170 171 172 173 174 175 176 177 178 179 180 181 182 183 184 185 186 187 188 189 190 191 192 193 194 195 196 197 198 |
defparam drawonlastbaronly=true //---------------------------------------------// //PRC_Deviation Trend Profile [BigBeluga] //version = 0 //05.07.24 //Iván González @ www.prorealcode.com //Sharing ProRealTime knowledge //---------------------------------------------// //---------------------------------------------// // INPUTS - VARIABLE CONFIGURATION //---------------------------------------------// // >> SMA and Deviation Parameters smaLength = 50 // SMA Length mult1 = 1 // Standart Deviation 1 mult2 = 2 // Standart Deviation 2 mult3 = 3 // Standart Deviation 3 // >> Distribution Profile Parameters showTp = 1 bins = 50 profileOffset = 30 // >> Theme Colors colUpR = 18 colUpG = 209 colUpB = 235 colDnR = 250 colDnG = 40 colDnB = 86 //---------------------------------------------// // PERSISTENT VARIABLES //---------------------------------------------// ONCE startIndex = -1 ONCE trend = 0 //---------------------------------------------// // MAIN CALCULATIONS //---------------------------------------------// // --- Moving Average and Volatility avg = Average[smaLength](close) atr = AverageTrueRange[200] // --- Deviation Levels using ATR stdv1 = avg + atr * mult1 stdv2 = avg + atr * mult2 stdv3 = avg + atr * mult3 stdv1m = avg - atr * mult1 stdv2m = avg - atr * mult2 stdv3m = avg - atr * mult3 maxDev = stdv3 minDev = stdv3m // --- Trend Detection avgDiff = avg - avg[5] IF atr > 0 THEN avgCol = avgDiff / atr ELSE avgCol = 0 ENDIF // --- Trend Change Logic IF avgCol CROSSES OVER 0.1 AND trend <> 1 THEN trend = 1 startIndex = barindex ENDIF IF avgCol CROSSES UNDER -0.1 AND trend <> -1 THEN trend = -1 startIndex = barindex ENDIF // --- SMA Color Based on Momentum r = 128 g = 128 b = 128 IF avgDiff > 0 THEN r = colUpR g = colUpG b = colUpB ELSE r = colDnR g = colDnG b = colDnB ENDIF //---------------------------------------------// // DRAWING LOGIC //---------------------------------------------// IF IsLastBarUpdate THEN // Draw deviation lines and labels // Nivel +1 DRAWSEGMENT(barindex, stdv1, barindex + 5, stdv1) COLOURED(200,200,200) DRAWTEXT("+1", barindex + 6, stdv1) // Nivel +2 DRAWSEGMENT(barindex, stdv2, barindex + 5, stdv2) COLOURED(200,200,200) DRAWTEXT("+2", barindex + 6, stdv2) // Nivel +3 DRAWSEGMENT(barindex, stdv3, barindex + 5, stdv3) COLOURED(200,200,200) DRAWTEXT("+3", barindex + 6, stdv3) // Nivel -1 DRAWSEGMENT(barindex, stdv1m, barindex + 5, stdv1m) COLOURED(200,200,200) DRAWTEXT("-1", barindex + 6, stdv1m) // Nivel -2 DRAWSEGMENT(barindex, stdv2m, barindex + 5, stdv2m) COLOURED(200,200,200) DRAWTEXT("-2", barindex + 6, stdv2m) // Nivel -3 DRAWSEGMENT(barindex, stdv3m, barindex + 5, stdv3m) COLOURED(200,200,200) DRAWTEXT("-3", barindex + 6, stdv3m) // Draw central SMA line DRAWSEGMENT(barindex, avg, barindex + 5, avg) COLOURED(r, g, b) STYLE(Line, 2) // --- Distribution Profile Logic IF showTp = 1 AND startIndex > -1 THEN UNSET($bin) loockback = barindex - startIndex IF loockback > 0 THEN profileRange = maxDev - minDev step = profileRange / bins FOR k = 0 TO bins - 1 DO $bin[k] = 0 NEXT FOR l = 0 TO loockback - 1 DO c = close[l] mi = minDev[l] s = (maxDev[l] - mi) / bins IF s > 0 THEN for i=0 to bins-1 do lower=mi+s*i upper=lower+s if c>=lower-s and c<=upper+s then $bin[i]=$bin[i]+1 endif next ENDIF NEXT maxVal = 0 FOR m = 0 TO bins - 1 DO IF $bin[m] > maxVal THEN maxVal = $bin[m] ENDIF NEXT profileStart = barindex + profileOffset FOR j = 0 TO bins - 1 DO val = $bin[j] IF val > 0 THEN lower = minDev + step * j upper = lower + step DRAWRECTANGLE(profileStart - val, upper, profileStart, lower) COLOURED(r, g, b, 50) BORDERCOLOR(r,g,b,150) ENDIF NEXT ENDIF ENDIF for i=0 to barindex do // Draw SMA and trend-change points on all bars IF trend[i] = 1 AND trend[i+1] <> 1 THEN drawpoint(barindex[i], avg[i],3) COLOURED(colUpR, colUpG, colUpB) drawpoint(barindex[i], avg[i],5) COLOURED(colUpR, colUpG, colUpB,30) ENDIF IF trend[i] = -1 AND trend[i+1] <> -1 THEN drawpoint(barindex[i], avg[i],3) COLOURED(colDnR, colDnG, colDnB) drawpoint(barindex[i], avg[i],5) COLOURED(colDnR, colDnG, colDnB,30) ENDIF next ENDIF //---------------------------------------------// RETURN avg COLOURED(r, g, b) STYLE(Line, 3) AS "SMA Trend" |
Share this
No information on this site is investment advice or a solicitation to buy or sell any financial instrument. Past performance is not indicative of future results. Trading may expose you to risk of loss greater than your deposits and is only suitable for experienced investors who have sufficient financial means to bear such risk.
ProRealTime ITF files and other attachments :
Find other exclusive trading pro-tools on ![]()
PRC is also on YouTube, subscribe to our channel for exclusive content and tutorials