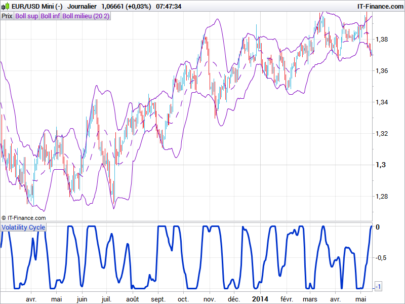
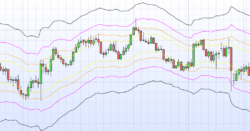
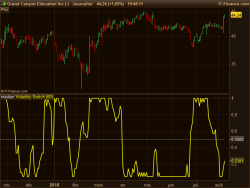
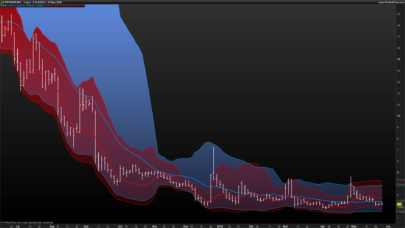
This indicator is calculated in the same way as Bollinger Bands.
However, it is based on an average of the last 9-26-52 periods, inspired by ichimoku.
The calculated standard deviation is 1
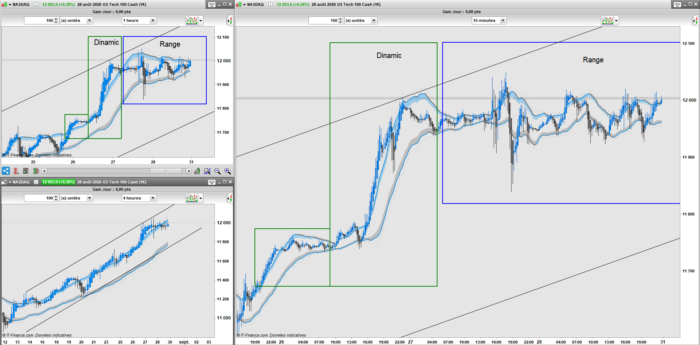
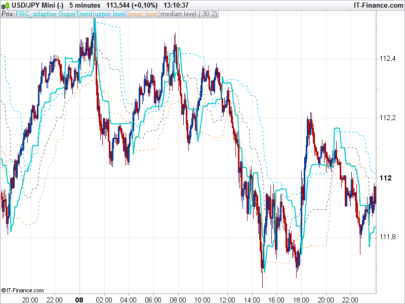
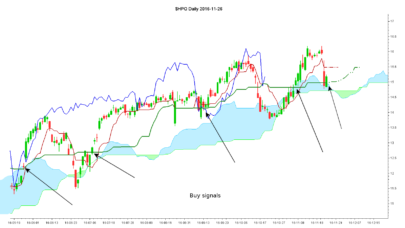
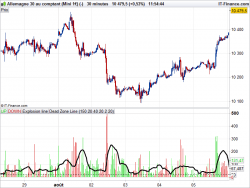
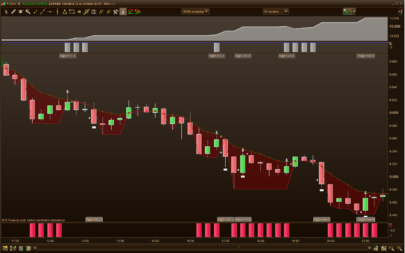
Its objective is to highlight dynamic or non-dynamic phases of the process.
If the price is within the bands over the long term, then a range is likely to be observed over the short term.
The dynamic phases will take place outside the bands in accordance with the long term.
Yours sincerely
IV
|
1 2 3 4 5 6 7 8 9 10 11 12 13 14 15 16 17 18 19 20 21 22 23 24 25 26 27 28 29 30 31 32 33 34 35 36 37 38 39 40 41 42 43 44 45 46 47 48 49 50 51 52 53 |
// //==================== Indicateur MM = average[20](close) Bolup1 = MM+STD[9]*1.0 Boldw1 = MM-STD[9]*1.0 Bolup2 = MM+STD[26]*1.0 Boldw2 = MM-STD[26]*1.0 Bolup3 = MM+STD[52]*1.0 Boldw3 = MM-STD[52]*1.0 Bolup = (Bolup1+Bolup2+Bolup3)/3 Boldw = (Boldw1+Boldw2+Boldw3)/3 Bolup11 = MM+STD[9]*1.25 Boldw11 = MM-STD[9]*1.25 Bolup22 = MM+STD[26]*1.25 Boldw22 = MM-STD[26]*1.25 Bolup33 = MM+STD[52]*1.25 Boldw33 = MM-STD[52]*1.25 Bolup1 = (Bolup11+Bolup22+Bolup33)/3 Boldw1 = (Boldw11+Boldw22+Boldw33)/3 Bolup111 = MM+STD[9]*0.75 Boldw111 = MM-STD[9]*0.75 Bolup222 = MM+STD[26]*0.75 Boldw222 = MM-STD[26]*0.75 Bolup333 = MM+STD[52]*0.75 Boldw333 = MM-STD[52]*0.75 Bolup2 = (Bolup111+Bolup222+Bolup333)/3 Boldw2 = (Boldw111+Boldw222+Boldw333)/3 if Bolup > Bolup[1] then RU = 36 GU = 147 BU = 219 elsif Bolup < Bolup[1] then RU = 101 GU = 101 BU = 101 endif if Boldw > Boldw[1] then RD = 36 GD = 147 BD = 219 elsif Boldw < Boldw[1] then RD = 101 GD = 101 BD = 101 endif return Bolup coloured(RU,GU,BU) style(line,2) as "ZoneAchat", Boldw coloured(RD,GD,BD) style(line,2) as "ZoneVente", Bolup1 coloured(73,73,73,70) style(dottedline,1) as "ZoneAchatSecondaire1", Boldw1 coloured(73,73,73,70) style(dottedline,1) as "ZoneVenteSecondaire1",Bolup2 coloured(73,73,73,70) style(dottedline,1) as "ZoneAchatSecondaire2", Boldw2 coloured(73,73,73,70) style(dottedline,1) as "ZoneVenteSecondaire2" |
Share this
No information on this site is investment advice or a solicitation to buy or sell any financial instrument. Past performance is not indicative of future results. Trading may expose you to risk of loss greater than your deposits and is only suitable for experienced investors who have sufficient financial means to bear such risk.
ProRealTime ITF files and other attachments :
Find other exclusive trading pro-tools on ![]()
PRC is also on YouTube, subscribe to our channel for exclusive content and tutorials


Hi IV Mcm,
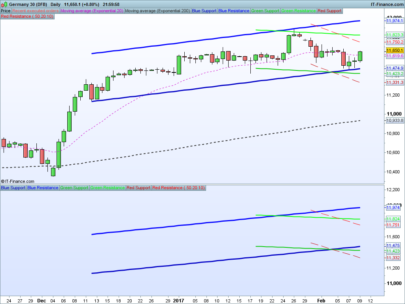
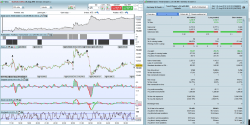
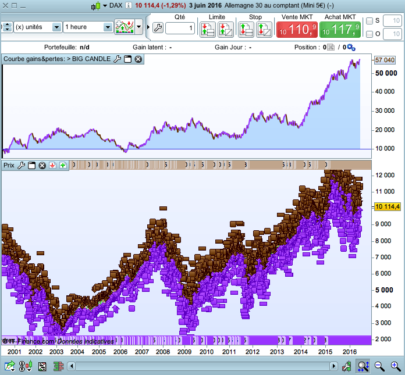
have you drawn the rectangles (Dinamic, Range) by yourself in the chart or are they calculated by a separate indicator?
Thanks,
Fabian
Myself to illustrate 😉