Change of volatility

v10.3
Change of volatility

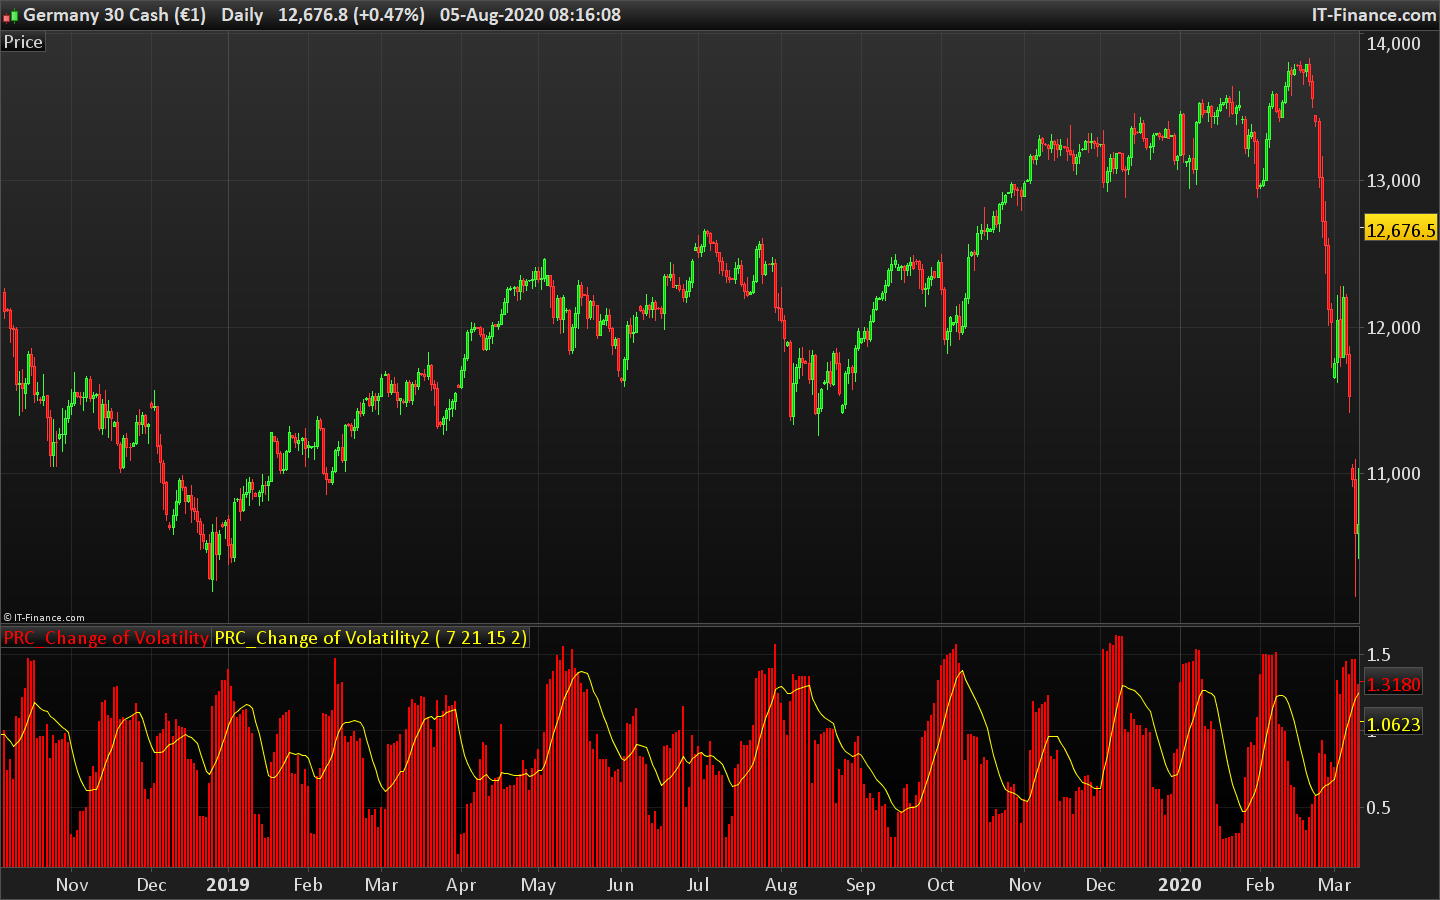
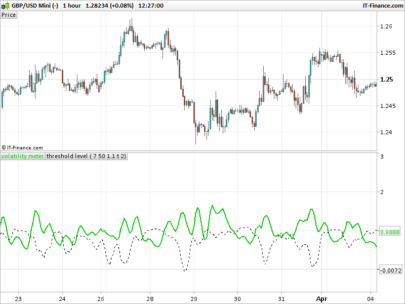
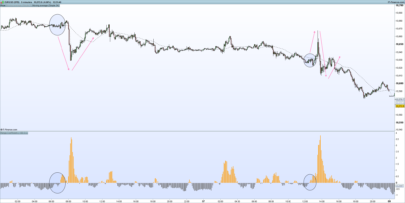
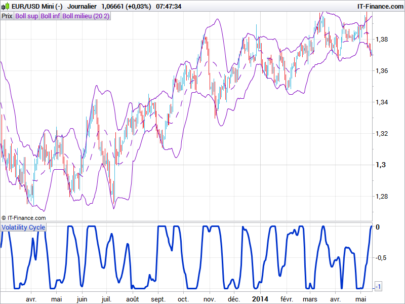
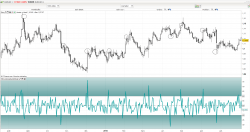
There are a lot of ways to measure volatility (changeability). One of them is calculation of the standard deviation of returns for a certain period of time. Sometimes the current volatility on a short period of time (for example, 6 days) is correlated with volatility of a larger period (for example 100 days). This indicator calculates the correlation of a short volatility Vol_short and a long volatilityVol_long. Vol_change=Vol_short/Vol_long

Standard deviation here is not that from a difference of closing prices, but from logarithms of the correlation of the current day closing price and closing price of a previous day: Mom[i]=Close[i]/Close[i+1].

Vol_k=Std(Mom,k),
where k is the period of volatility change.

(description from the author)

Indicator of volatility converted following a request in the indicators forum section.


Share this

Risk disclosure:

No information on this site is investment advice or a solicitation to buy or sell any financial instrument. Past performance is not indicative of future results. Trading may expose you to risk of loss greater than your deposits and is only suitable for experienced investors who have sufficient financial means to bear such risk.

ProRealTime ITF files and other attachments : How to import ITF files into ProRealTime platform?

PRC is also on YouTube, subscribe to our channel for exclusive content and tutorials

avatar
Register or

Likes

avatar avatar avatar avatar avatar
Related users ' posts
Nicolas All conditions under parenthesis for the c1 to c4 conditions should be inverted. 
tomus Can you give an example of the overbought codes please? Thanks.
ams123 Frank Merci Nicholas -:)
Wilko And not only readable.... makes it much easier to iterate different entry/exit-conditions, d...
IGOSNELL Hi Interesting strategy, when I used $ M-R Dif EURUSD M15 Long if does not enter any positi...
ilvillans HI, I modified the system, from good results but from this error: Replace the variables wit...
gabri
7 years ago
Marcel Thank you for this one. I played around with this indicator with Bollinger Bands around it i...
Nicolas Restart your platform in order to be sure to use the last version, there was a version rollb...
bertrandpinoy bonjour voud pouvez m envoyer le code modifier par vous?
Nicolas Désolé , je ne comprends pas votre question.
Nicolas Rien, il faut l'appliquer sur la charte. Soit le mettre sur le graphique du prix, à l'aide d...
signorini Merci pour votre réponse. Je l'applique sur la charte, j'utilise la petite clé pour effacer ...
signorini Je vous remercie, Nicolas. C'est fixé. Très bon week-end.
Abz  hi , you need to add the indicator from the "price" menu in chart
Francesco Thank you Abz!
phanz Hi Nicolas, this is an interesting strategy. For long position, I assume entry when prices ...
Nicolas
7 years ago
supertiti bonjour à tous J'utilise cet indicateur depuis plusieurs mois, une fois règlé "K" à sa conv...
Nicolas
7 years ago
T3 Velocity
T3 Velocity
16
Indicators
tatankayotanka As you can do to set a marker directly in the price property page and then view it such as m...
Nicolas It may be a good idea to discuss this in the forum instead. Please open a new topic in probu...
Wester Hi, is this more or less the same as the TTM Squeeze indicator (john carter)
rpreviteri Hi Nicolas, thanks a  loto for sharing your knowliedge, Wasn't the original momentum pinball...
air Thank you!  
elanoa Buonasera sig. Nicolas......sarebbe possibile far in modo che quando l'indicatore raggiunga ...
Pelle Nævestad Thanks Nicolas, this is a keeper!
Chicane23 Hi, when uploaded the WAE isnt showing histogram; only line. Is there a way to modify?
Nicolas Change the way the lines are displayed in the indicator settings window : histogram, lines, ...
Dimi.A Perfect for counter-trend scalping. I like this!
viktorthuns Hi Nicolas! Great work you've done with all your indicators. Just wondering about the code a...
Nicolas the value is not a boolean but an average of an addition of booleans. As stated in the descr...
Doctrading I forgot to write at the beginning :  a = 50 b = 50 These are intermediate levels Sorry
DerPat Thank you. This one could be an aid in my current research on stochastics.
Pelayo it is possible that in line 12 we should put seuilinf=-b, thaks for all
lglmrc Can't make it work, says: "Define p variable"
Ezio Hi Xel and thanks, do you know if there is a way in PRC of reading/counting intraday ticks?...
inadis ive just discovered this, i must say very nice thanks.
phili711 Bonjour Si la moyenne 100 est au dessus de la moyenne 20 le trend est baissier zlors pourqu...
Nicolas La comparaison se fait entre la valeur de la moyenne actuelle et telle qu'elle était il y a ...
Thomas007 we should definitely open a new thread for intraday trading - can we post the link once it's...
r.angel It seems that the formula needs a SQRT (that is Vyangzhang = SQRT(...))
RickTrader I think to have annualized view of this historical volatility you will need : Vyangzhang =...

Top