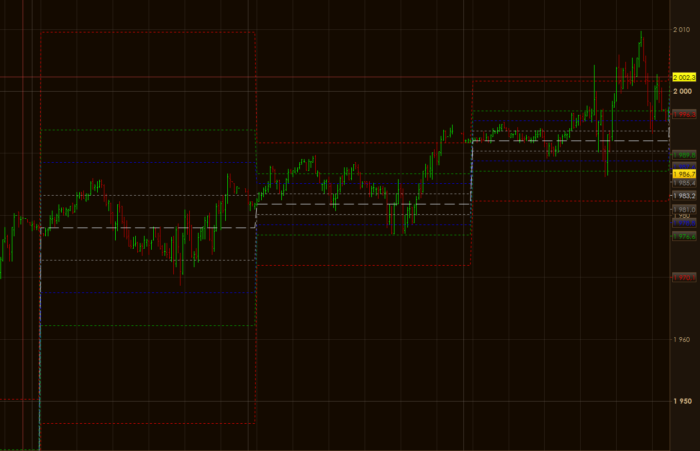
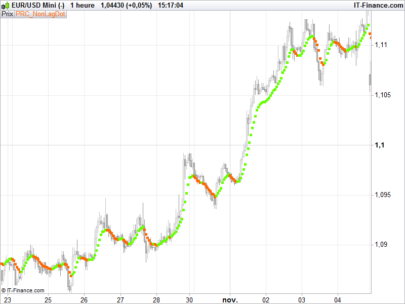
Camarilla pivot points indicator made of previous day close, high and low.
|
1 2 3 4 5 6 7 8 9 10 11 12 13 14 15 16 17 18 19 |
REM Camarilla Pivot Points myH = ( DHIGH(1) ) myL = ( DLOW(1) ) myC = ( DCLOSE (1) ) PP = myC//PP = Previous Day's Close R1 = ((myH-myL) * 1.1)/12+myC RR2 = ((myH-myL)*1.1)/6+myC // Note: RR2 is used instead of R2 since R2 is the symbol for "R squared" in probuilder language. R3 = ((myH-myL)*1.1)/4+myC R4 = ((myH-myL)*1.1)/2+myC S1 = myC-((myH-myL)*1.1)/12 S2 = myC-((myH-myL)*1.1)/6 S3 = myC-((myH-myL)*1.1)/4 S4 = myC-((myH-myL)*1.1)/2 RETURN PP COLOURED(0,0,0) AS "CAMA PP" , R1 COLOURED(155,155,155) AS "CAMA R1" , RR2 COLOURED(0,0,255) AS "CAMA R2" , R3 COLOURED(0,180,0) AS "CAMA R3" , R4 COLOURED(255,0,0) AS "CAMA R4" , S1 COLOURED(155,155,155) AS "CAMA S1" , S2 COLOURED(0,0,255) AS "CAMA S2" , S3 COLOURED(0,180,0) AS "CAMA S3" , S4 COLOURED(255,0,0) AS "CAMA S4" |
Share this
No information on this site is investment advice or a solicitation to buy or sell any financial instrument. Past performance is not indicative of future results. Trading may expose you to risk of loss greater than your deposits and is only suitable for experienced investors who have sufficient financial means to bear such risk.
ProRealTime ITF files and other attachments :
Find other exclusive trading pro-tools on ![]()
PRC is also on YouTube, subscribe to our channel for exclusive content and tutorials


Hi,
Very useful, thanks for it ! I was just looking to make an indicator myself.
I think one day I will make a backtest with the usual rules.
Seems to be profitable on the long run… with of course some drawdown.
Best Regards,
The code is very interesting… but did you solve the problem with the week-end gaps / Monday ?
We should exclude the calculation of camarilla pivots on the Monday (calculation based on the Sunday), we shoud calculate them on the Friday, not on the Sunday.
I can’t backtest a strategy with this litte issue.
Later, I will also make an indicator for the classical pivot points and the Fibonacci pivot points.Best Regards,
Hi TradingDeckard ,can you give me yearly pivot, i’ve tried change DHigh to YHigh error. i’m long term trader Please Help
Thanks
Bonjour Nicolas,
Je cherche à utiliser cet indicateur pour de l’intra day.
L’objectif est de tester sa pertinence sur des times frames plus courtes que juste le Daily.
Par exemple : 60 min, 120 min ou même 240 minutes.
Pouvez vous me dire par quoi devrais-je remplacer les expressions suivantes pour obtenir des PP camarillas sur les X derniers minutes par exemple ou Y dernières heures ou Z dernières barres :
myH = ( DHIGH(1) )
myL = ( DLOW(1) )
myC = ( DCLOSE (1) )
Un GRAND merci si vous pouvez m’aider.
Oui j’imagine que cela doit être très simple pour vous, mais pour moi…
Ou encore mieux proposer cet indicateur tout neuf avec ces options de Times Frames modulables (plus courtes).
Ce serait top. 🙂
Cet indicateur: https://www.prorealcode.com/prorealtime-indicators/pivot-points-intraday/
Permet de créer des points pivots à l’aide des valeurs comprises entre 2 horaires. Plus simple et plus rapide que de chercher à faire un multitimeframe à la main 🙂
La formule des points pivots sera à adapter avec celle des Camarillas.
Merci Nicolas pour cette réponse rapide et cette information.
J’ai regardé et testé et cela ne me semble pas vraiment souple/simple. Surtout si je veux avoir des PP Camarillas chaque 4 heures depuis 05h00 du matin et jusqu’à 21h00 par exemple.
D’autres parts et après mûres réflexions, avoir l’opportunité d’avoir un indicateur permettant de tracer des PP Camarilla ou autres types de PP (Woodies – De mark – Fibo…) sur N dernières barres comme des barres en ticks ou en volumes ou encore évidemment en durée (min – heures) permettrait à mon sens d’avoir un outils sur ce sujet : complet, instructif, modulable et sûrement exploitable.
Mais ça, je ne sais pas faire. Et oui, j’ai essayé et ce n’est hélas définitivement pas mon univers.
Donc si vous Nicolas avez le loisir de le réaliser ou si quelqu’un s’intéresse à l’idée : Go ! je suis super pour 😉
A suivre ?
Sorry, but this indicator doesn’t update the levels in real time. They are draw and stucked at the previous daily. Anyone got this issue?
I leave an update. The indicator works as it plots in a progressive way the Cama levels on the current day (unlike the classic Pivot which are plotted at the end of the session for the next day)