
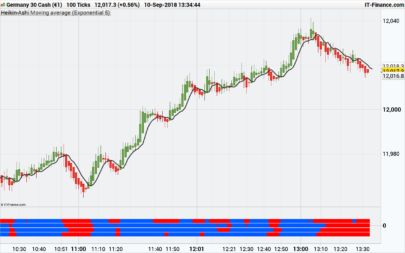
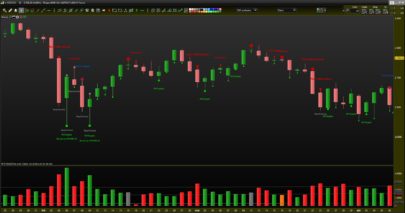
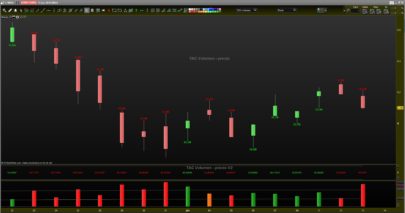
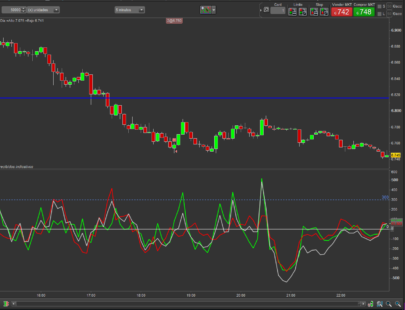
This indicator has been translated from TradingView. Credits and thanks go to the original author Ricardo M Arjona @XeL_Arjona. It compares Buying & Selling Pressure and offers 3 ways to present the result. After you import the “itf” file, you tick one of the boxes (and only one).
- “vmacd” is the option by default which presents the Buy to Sell Convergence/Div Oscillator
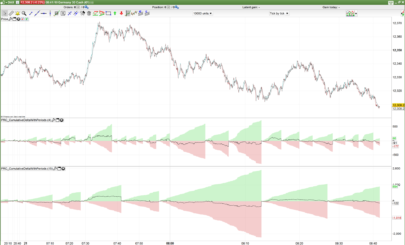
- “vinv” is the option which presents Buy to Sell Conv/Div as Cumulative
- “norm” is the option which presents the Normalised (Filtered) data
Detailed description by the author is in the bottom of the indicator.
Enjoy!
|
1 2 3 4 5 6 7 8 9 10 11 12 13 14 15 16 17 18 19 20 21 22 23 24 25 26 27 28 29 30 31 32 33 34 35 36 37 38 39 40 41 42 43 44 45 46 47 48 49 50 51 52 53 54 55 56 57 58 59 60 61 62 63 64 65 66 67 68 69 70 71 72 73 74 75 76 77 78 79 80 81 82 83 84 85 86 87 88 89 90 91 92 93 94 95 96 97 98 99 100 101 102 103 104 105 106 107 108 109 110 111 112 113 114 115 116 117 118 119 120 121 122 123 124 125 126 127 128 129 130 131 132 133 134 135 136 137 138 139 140 141 142 143 144 145 146 147 148 149 150 151 152 153 154 155 156 157 158 159 160 161 162 163 164 165 166 167 168 169 170 171 172 173 174 175 176 177 178 179 180 181 182 183 184 185 186 187 188 189 190 191 192 193 194 195 196 197 198 199 200 201 202 203 204 205 206 207 208 209 210 211 212 213 214 215 216 217 218 219 220 221 222 223 224 225 226 227 228 229 230 231 232 233 234 235 236 237 238 239 240 241 242 243 244 245 246 247 248 249 250 251 252 253 254 255 256 257 258 259 260 261 262 263 264 265 266 267 268 269 270 271 272 273 274 |
DEFPARAM CALCULATEONLASTBARS = 1000 // BUY & SELL VOLUME TO PRICE PRESSURE // Ver. 1.15.b2.27.07.2015 // By Ricardo M Arjona @XeL_Arjona // Translated from TradingView //study("BUY & SELL VOLUME TO PRICE PRESSURE by @XeL_Arjona", shorttitle="BSVP_XeL", precision=0) //signal = input(title="Base for FastMA Periods:", type=integer, defval=3) //long = input(title="Buy to Sell Conv/Div Lookback:", type=integer, defval=27) //vmacd = input(true, title="Buy to Sell Convergence/Div OSC:") //vinv = input(false, title="Buy to Sell Conv/Div as cummulative:") //norm = input(false, title="Normalised (Filtered) Version:") signal = 3 long = 21 //vmacd = 1 //vinv = 0 //norm = 0 // Bull and Bear "Power-Balance" by Vadim Gimelfarb Algorithm's if close<open then if close[1]<open then BP = max(high-close[1], close-low) else BP = max(high-open, close-low) endif elsif close>open then if close[1]>open then BP = high-low else BP = max(open-close[1], high-low) endif elsif high-close>close-low then if close[1]<open then BP = max(high-close[1],close-low) else BP = high-open endif elsif high-close<close-low then if close[1]>open then BP = high-low else BP = max(open-close[1], high-low) endif elsif close[1]>open then BP = max(high-open, close-low) elsif close[1]<open then BP = max(open-close[1], high-low) else BP = high-low endif if close<open then if close[1]>open then SP = max(close[1]-open, high-low) else SP = high-low endif elsif close>open then if close[1]>open then SP = max(close[1]-low, high-close) else SP = max(open-low, high-close) endif elsif high-close>close-low then if close[1]>open then SP = max(close[1]-open, high-low) else SP = high-low endif elsif high-close<close-low then if close[1]>open then SP = max(close[1]-low, high-close) else SP = open-low endif elsif close[1]>open then SP = max(close[1]-open, high-low) elsif close[1]<open then SP = max(open-low, high-close) else SP = high-low endif TP = BP+SP // RAW Pressure Volume Calculations BPV = (BP/TP)*volume SPV = (SP/TP)*volume TPV = BPV+SPV BPVavg = ExponentialAverage[signal](ExponentialAverage[signal](BPV)) // ema(ema(BPV,signal),signal) SPVavg = ExponentialAverage[signal](ExponentialAverage[signal](SPV)) //ema(ema(SPV,signal),signal) TPVavg = ExponentialAverage[signal](WeightedAverage[signal](TPV)) //ema(wma(TPV,signal),signal) // Karthik Marar's Pressure Volume Normalized Version (XeL-MOD.) VN = volume/ExponentialAverage[long](volume) //ema(vol,long) BPN = ((BP/ExponentialAverage[long](BP))*VN)*100 SPN = ((SP/ExponentialAverage[long](SP))*VN)*100 TPN = BPN+SPN nbf = ExponentialAverage[signal](WeightedAverage[signal](BPN)) // ema(wma(BPN,signal),signal) nsf = ExponentialAverage[signal](WeightedAverage[signal](SPN)) //ema(wma(SPN,signal),signal) tpf = ExponentialAverage[signal](WeightedAverage[signal](TPN)) //ema(wma(TPN,signal),signal) ndif = nbf-nsf // Conditional Selectors for RAW/Norm if BPV>SPV then BPc1 = BPV else BPc1 = -abs(BPV) endif if BPN>SPN then BPc2 = BPN else BPc2 = -abs(BPN) endif if SPV>BPV then SPc1 = SPV else SPc1 = -abs(SPV) endif if SPN>BPN then SPc2 = SPN else SPc2 = -abs(SPN) endif if norm then BPcon = BPc2 else BPcon = BPc1 endif if norm then SPcon = SPc2 else SPcon = SPc1 endif if norm then BPAcon = nbf else BPAcon = BPVavg endif if norm then SPAcon = nsf else SPAcon = SPVavg endif if norm then TPAcon = tpf else TPAcon = TPVavg endif // Volume Pressure Convergence Divergence by XeL_Arjona if vinv then vpo1 = ((summation[long](BPVavg)-summation[long](SPVavg)))/(summation[long](TPVavg))*100 else vpo1 = ((BPVavg-SPVavg)/TPVavg)*100 endif if vinv then vpo2 = (( summation[long](nbf)-summation[long](nsf))/summation[long](tpf))*100 else vpo2 = ((nbf-nsf)/tpf)*100 endif vph = (vpo1 - vpo2) // Plot Indicator if vph > vph[1] then r1 = 255 g1 = 255 b1 = 0 else r1=255 g1=0 b1=0 endif if vpo1 > 0 then ir2 = 0 g2=255 b2=0 else ir2=255 g2=0 b2=0 endif if vpo2 > 0 then r3 = 0 g3 = 255 b3 = 0 else r3 = 255 g3 = 0 b3 = 0 endif if (vpo1 > vpo1[1] and vpo2 > vpo2[1]) or (BPcon > SPcon and BPAcon > SPAcon) then BACKGROUNDCOLOR(0,255,0,25) endif if (vpo1 < vpo1[1] and vpo2 < vpo2[1]) or (BPcon < SPcon and BPAcon < SPAcon) then BACKGROUNDCOLOR(255,0,0,25) endif return (1-vmacd)*round(SPcon,0) style(histogram) coloured("red") as "Selling", (1-vmacd)*round(BPcon,0) style(histogram) coloured("green") as "Buying", (1-vmacd)*round(SPAcon,0) style(line,2) coloured("red") as "SPAvg", (1-vmacd)*round(BPAcon,0) style(line,2) coloured("green") as "BPAvg", (vmacd)*round(vpo1,0) style(line,3) coloured(ir2,g2,b2,90) as "VPO1", (vmacd)*round(vpo2,0) style(line,1) coloured(r3,g3,b3,90) as "VPO2", (vmacd)*round(vph,0) style(histogram) coloured(r1,g1,b1,90) as "VPH" DISCLAIMER: // // The Following indicator/code IS NOT intended to be // a formal investment advice or recommendation by the // author, nor should be construed as such. Users // will be fully responsible by their use regarding // their own trading vehicles/assets. // // The embedded code and ideas within this work are // FREELY AND PUBLICLY available on the Web // for NON LUCRATIVE ACTIVITIES and must remain as is. // // Pine Script code MOD's and adaptations by @XeL_Arjona // with special mention in regard of: // + Buy (Bull) and Sell (Bear) "Power Balance Algorithm" by: // Stocks & Commodities V. 21:10 (68-72): // "Bull And Bear Balance Indicator by Vadim Gimelfarb" // + Normalisation (Filter) from Karthik Marar's VSA work: // http://karthikmarar.blogspot.mx // + Buy to Sell Convergence / Divergence and Volume Pressure // Conunterforce Histogram Ideas by: @XeL_Arjona // // WHAT IS THIS? // // The following indicators try to acknowledge in a K-I-S-S // approach to the eye (Keep-It-Simple-Stupid), the two most // important aspects of nearly every trading vehicle: // -- PRICE ACTION IN RELATION BY IT'S VOLUME -- // // A) Volume Pressure Histogram: // Columns plotted in positive are considered the dominant // Volume Force for the given period. All "negative" columns // represents the counterforce Vol.Press against the dominant. // // B) Buy to Sell Convergence / Divergence: // It's a simple adaptation of the popular "Price // Percentage Oscillator" or MACD but taking Buying Pressure // against Selling Pressure Averages, so given a Positive // oscillator reading (>0) represents Bullish dominant Trend // and a Negative reading (<0) a Bearish dominant Trend. // Histogram is the diff between RAW Volume Pressures // Convergence/Divergence minus Normalised ones (Signal) // which helps as a confirmation. // // C) Volume bars are by default plotted from RAW Volume // Pressure algorithms, but they can be as well filtered // with Karthik Marar's approach against a "Total Volume // Average" in favor to clean day to day noise like HFT. // // D) ALL NEW IDEAS OR MODIFICATIONS to these indicators are // Welcome in favor to deploy a better and more accurate readings. // I will be very glad to be notified at Twitter: @XeL_Arjona // // Any important addition to this work MUST REMAIN // PUBLIC by means of CreativeCommons CC & TradingView. // 2015 |
Share this
No information on this site is investment advice or a solicitation to buy or sell any financial instrument. Past performance is not indicative of future results. Trading may expose you to risk of loss greater than your deposits and is only suitable for experienced investors who have sufficient financial means to bear such risk.
ProRealTime ITF files and other attachments :
Find other exclusive trading pro-tools on ![]()
PRC is also on YouTube, subscribe to our channel for exclusive content and tutorials


Bonjour , et merci pour le partage , j’ai un message d’erreur sur la ligne 216 signe 28 , par quoi remplacer la virgule SVP ( je suis sur PRT 10.3 ) Merci pour votre réponse et bonne journée .
As this section of the forum is in English, I’ll reply in English. I’m using PRT v11, so I d’ont have any error. Can you please post a screenshot of the error message? Or else try to replace all the instructions of color (“red”), etc. with (255,0,0) in line 216
return (1-vmacd)*round(SPcon,0) style(histogram) coloured(255,0,0) as “Selling”
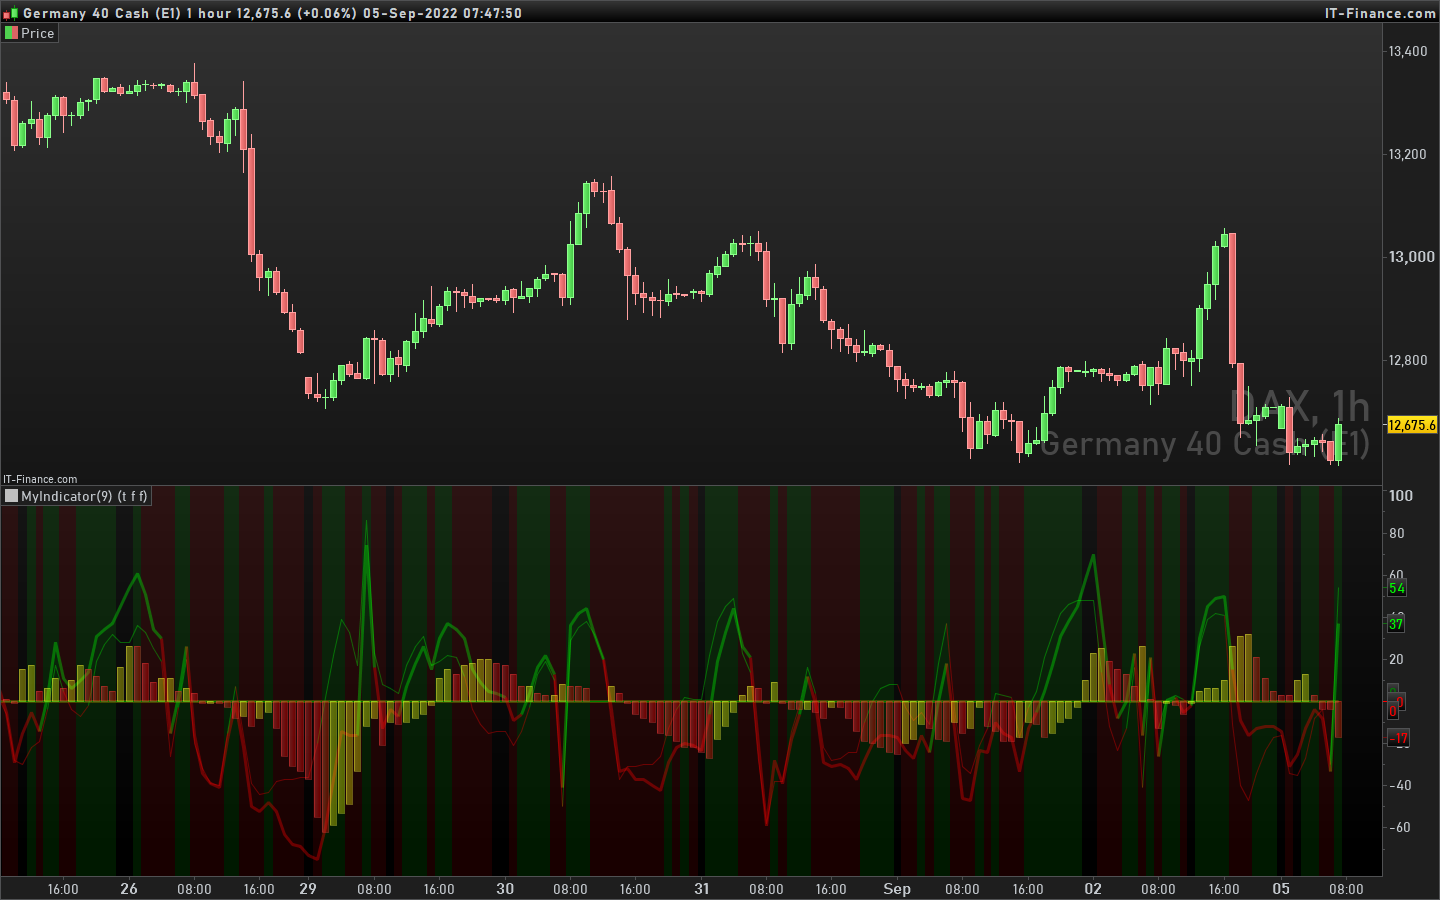
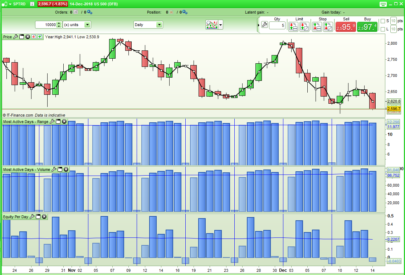
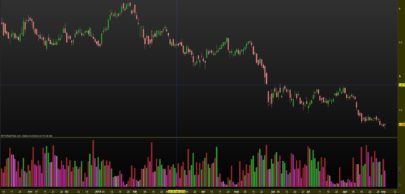
Don’t understand where it says: “Volume Pressure Histogram: Columns plotted in positive are considered the dominant Volume Force for the given period. All “negative” columns represents the counterforce Vol.Press against the dominant.”
In the above picture at the beginning day 26 8:00 the columns are negative and so is a counterforce against the dominant but for me the dominant force is negative. Can you explain this better? Thank you.
Not sure to understand the question. However, the columns (Histogram) represent the variable “VPH”, which is lagging behind VPO1 and VPO2. So, you might have VPO1 and VPO2 negative while VPH is still positive. A bar or two later VPH will catch up.