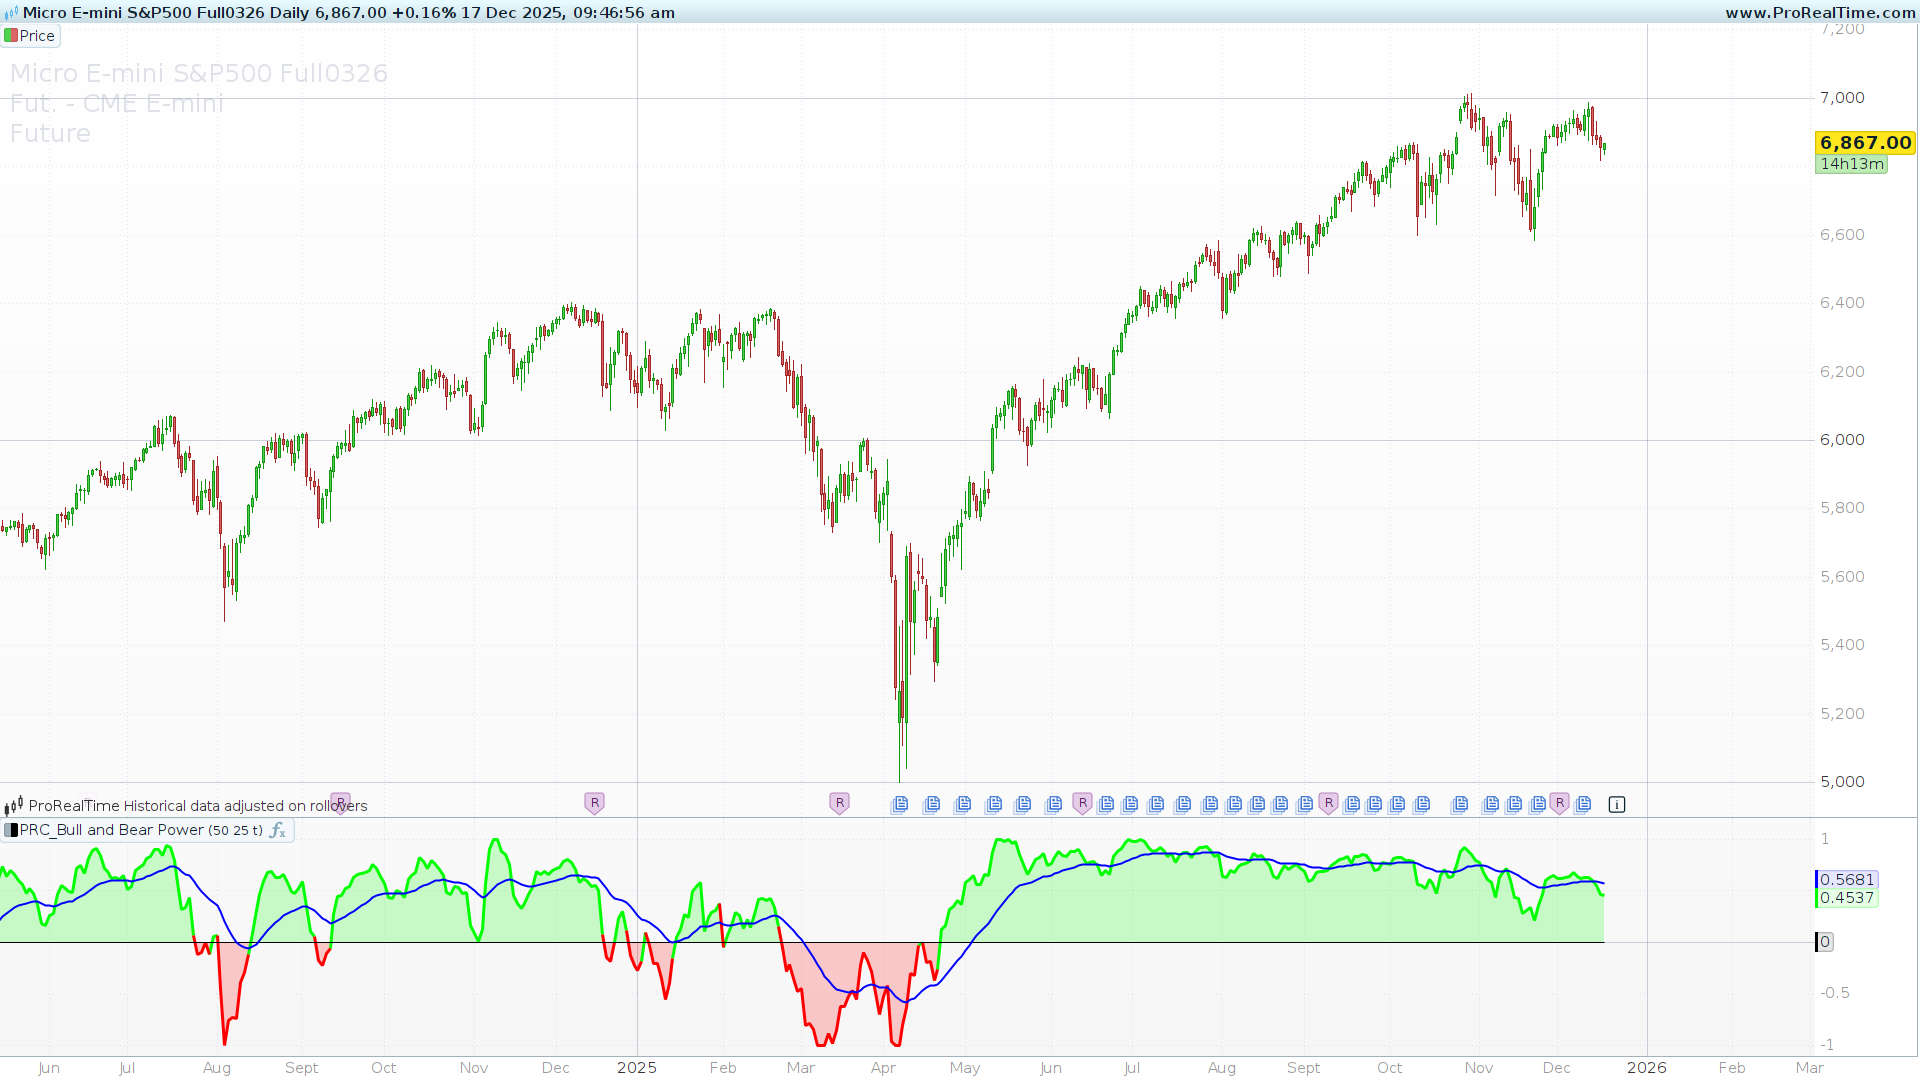
The financial markets are often described as a constant tug-of-war between buyers (Bulls) and sellers (Bears). Understanding who is currently winning this battle is the key to identifying trends and potential reversals.
The Bull and Bear Power indicator by LefAlgo is a sophisticated evolution of Dr. Alexander Elder’s classic Elder-Ray Index. While the original concept separates Bull Power and Bear Power into two different histograms, this version combines them into a single, comprehensive oscillator. Furthermore, it introduces a normalization algorithm that allows traders to gauge the intensity of the move relative to recent history, regardless of the asset’s price scale.
How it Works
The core logic of this indicator relies on the relationship between the price extremes (High and Low) and an Exponential Moving Average (EMA).
-
Bull Power: Calculates the ability of buyers to push prices above the average consensus (
High - EMA). -
Bear Power: Calculates the ability of sellers to push prices below the average consensus (
Low - EMA). -
Net Sentiment: The indicator sums these two values to derive a net result (
bbP).
If the result is positive, the Bulls are exerting more force. If negative, the Bears are in control.
Key Features
What sets LefAlgo’s version apart are two specific enhancements found in the code:
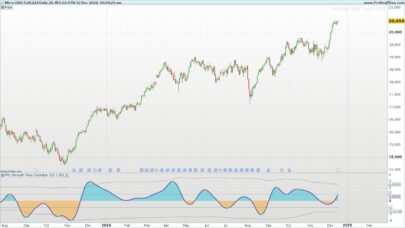
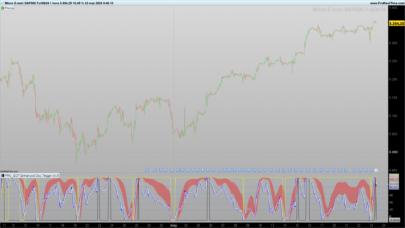
1. Adaptive Normalization Raw values can be difficult to interpret when switching between assets with different prices (e.g., EUR/USD vs. DAX). This indicator includes a normalization feature (isNormalized).
-
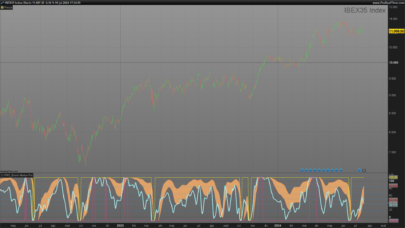
When active, the code tracks the highest and lowest values of the oscillator over the lookback period.
-
It then re-scales the current value to a range, making it easier to identify overextended conditions visually.
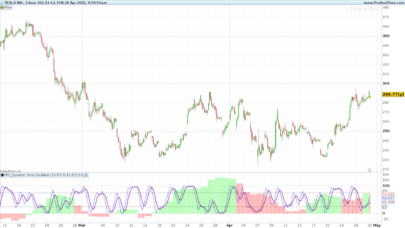
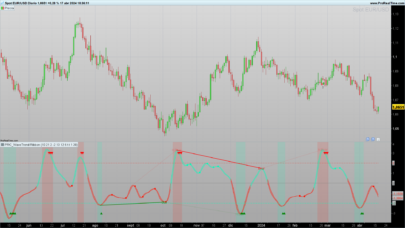
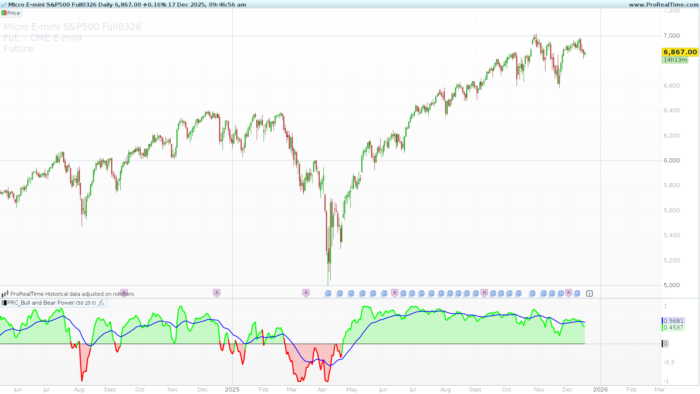
2. Signal Smoothing The indicator plots a Signal Line (displayed in blue). This is a moving average of the Bull/Bear power itself. This line helps filter out market noise and provides clearer crossover signals for trend following.
Configuration & Settings
You can modify the following variables in the indicator settings window to fit your trading style:
-
lengthInput (Default: 50): The number of periods used for the baseline Exponential Moving Average. Increasing this value makes the indicator less sensitive and better suited for long-term trends.
-
maLength (Default: 50): The length of the Signal Line (Moving Average of the oscillator). A lower value will make the signal line hug the histogram closer, while a higher value will smooth it out.
-
isNormalized (Default: 1): A switch to toggle normalization.
-
1: Normalization is ON. The indicator adapts to the recent volatility range.
-
0: Normalization is OFF. The indicator displays raw price values.
-
Trading Application
-
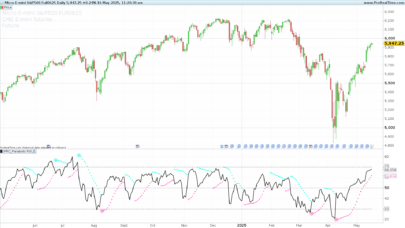
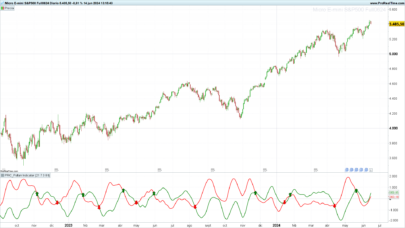
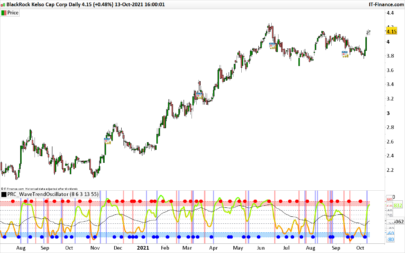
Zero Line Crossovers: The most direct signal is the crossover of the zero line. When the histogram turns Green (crosses over 0), it indicates that Bullish pressure has overcome Bearish pressure. Conversely, a switch to Red (crosses under 0) suggests the Bears have taken control.
-
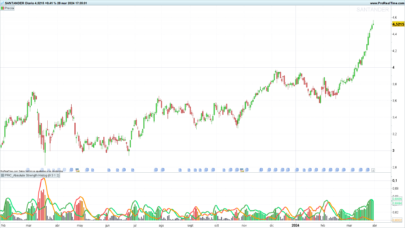
Trend Strength: The height of the histogram bars represents the intensity of the trend. In the normalized mode, extreme readings may suggest a potential exhaustion of the current move.
-
Signal Line Filtering: You can use the blue Signal Line as a filter. For example, only taking long positions when the histogram is above the Signal Line.
The Code
You can copy and paste the following code into your ProRealTime platform window:
|
1 2 3 4 5 6 7 8 9 10 11 12 13 14 15 16 17 18 19 20 21 22 23 24 25 26 27 28 29 30 31 32 33 34 35 36 37 38 39 40 41 42 43 44 45 46 47 48 49 50 51 52 53 54 55 56 |
//-------------------------------------------------// //PRC_Bull and Bear Power by LeafAlgo //version = 0 //17.12.25 //Iván González @ www.prorealcode.com //Sharing ProRealTime knowledge //-------------------------------------------------// // Inputs //-------------------------------------------------// lengthInput = 50 maLength = 50 isNormalized = 1 //-------------------------------------------------// // Bull & Bear Power //-------------------------------------------------// bullPower = high - average[lengthInput,1](close) bearPower = low - average[lengthInput,1](close) bbP = bullPower + bearPower if barindex>lengthInput then bbPh = max(bbP,bbPh[1]) bbPl = min(bbP,bbPl[1]) bbPn = ((bbP - bbPl) / (bbPh - bbPl) - 0.5) * 2 endif //-------------------------------------------------// // Normalization //-------------------------------------------------// if isNormalized then bbPfinal = bbPn else bbPfinal = bbP endif //-------------------------------------------------// // Signals //-------------------------------------------------// zeroLine = 0 upCondition = bbPfinal crosses over zeroLine downCondition = bbPfinal crosses under zeroLine if bbPfinal > 0 then r=0 g=255 else r=255 g=0 endif colorbetween(bbPfinal,0,r,g,0,50) //-------------------------------------------------// // Moving Average //-------------------------------------------------// movingAverage = average[maLength,1](bbPfinal) //-------------------------------------------------// return bbPfinal as "Bull/Bear Power"coloured(r,g,0)style(line,3), zeroLine as "zero", movingAverage as "MA" coloured("blue")style(line,2) |
Share this
No information on this site is investment advice or a solicitation to buy or sell any financial instrument. Past performance is not indicative of future results. Trading may expose you to risk of loss greater than your deposits and is only suitable for experienced investors who have sufficient financial means to bear such risk.
ProRealTime ITF files and other attachments :
Find other exclusive trading pro-tools on ![]()
PRC is also on YouTube, subscribe to our channel for exclusive content and tutorials