ATR & Volume Adjusted Momentum indicator

v10.3
ATR & Volume Adjusted Momentum indicator

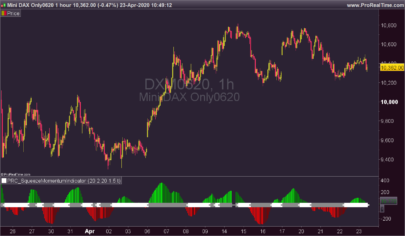
The ATR and Volume adjusted momentum oscillator include a ratio made of 2 double smoothed exponential average of the momentum compared to the absolute one.

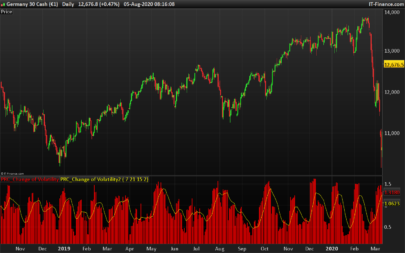
The AbsMtm is a calculation of the momentum weighted with Volumes. So this technical indicator should be used on a security that deals with Volumes.

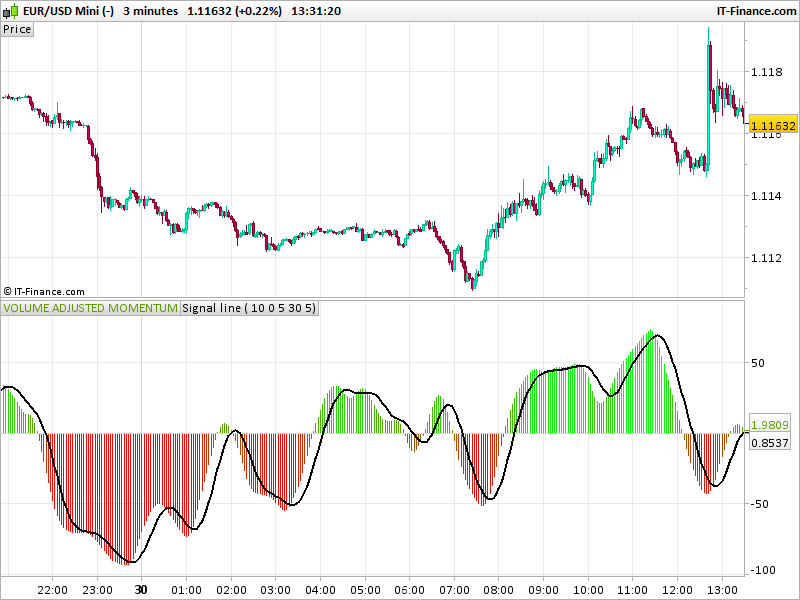
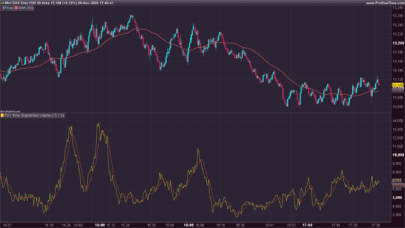
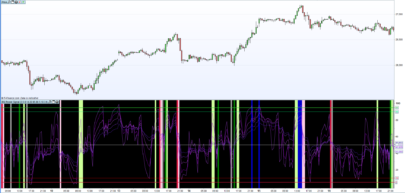
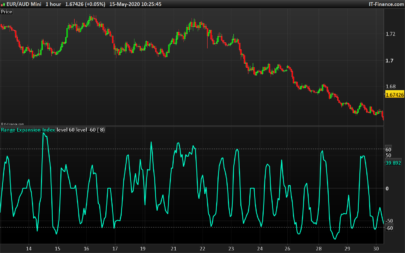
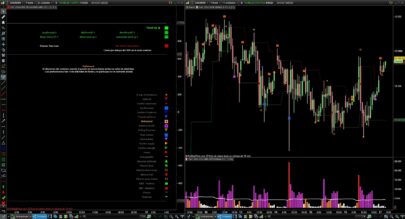
Trading signals can be compared to the MACD, the main oscillator is in histogram, while the signal line is a curve. Bullish and bearish signals are made with cross over and cross under the histogram and the signal line. You can also wait for the histogram to cross the 0 line which represents the frontier between the buyers and the sellers.

Translation of a MetaStock code by a request in the Spanish forum.


Share this

Risk disclosure:

No information on this site is investment advice or a solicitation to buy or sell any financial instrument. Past performance is not indicative of future results. Trading may expose you to risk of loss greater than your deposits and is only suitable for experienced investors who have sufficient financial means to bear such risk.

ProRealTime ITF files and other attachments : How to import ITF files into ProRealTime platform?

PRC is also on YouTube, subscribe to our channel for exclusive content and tutorials

  1. Maz • 05/30/2017 #

    Volume on currency crosses?

    • Nicolas • 05/30/2017 #

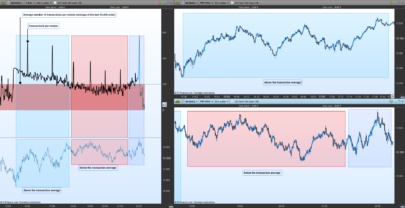
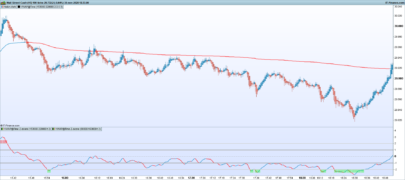
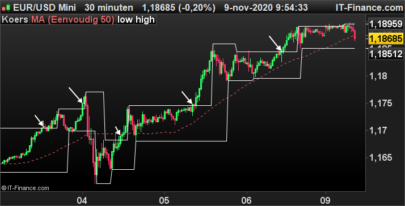
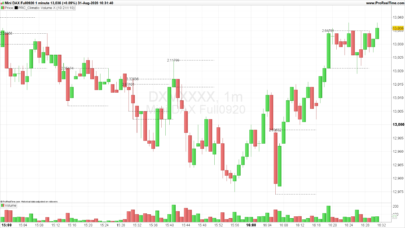
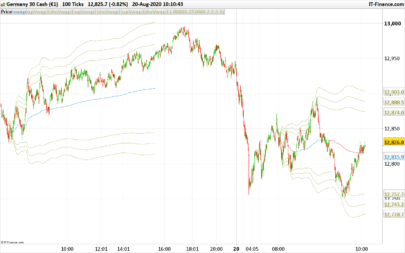
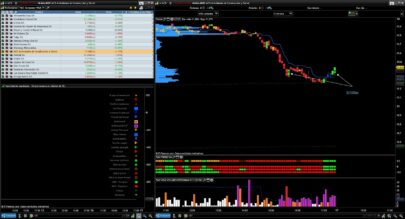
      The featured image of the post do not deserve the indicator you are right, I attached other examples on US500.
      The Volume weight is only an addition in the indicator formula, so as you stated it works also on instruments with no Volume.

  2. Jean-Pierre Poulain • 05/30/2017 #

    When I buy and when I sell ?

    • Nicolas • 05/30/2017 #

      It is described in the post already 🙂 The BUY/SELL signals are quite similar of what you can get with a MACD for instance.

avatar
Register or

Likes

avatar avatar avatar avatar avatar avatar avatar avatar avatar
Related users ' posts
kal Buenos días TACBOLSA. Estoy muy interesado en ver tu blog para ver la explicación con detall...
1Randy I would be interested an invite to your blog. I am still learning about the VSA and it looks...
repropel Buenos días TACBOLSA. Yo también estoy interesado en visitar tu blog. Podrías enviarme una i...
Maxime Baudin Very useful! Thanks Mat, and Happy New Year
nicko Great work. Thank you. However I am having trouble getting it to print in the first bar. If ...
Marie-Eve Vergoz Bonsoir - Voici l'erreur qui est signalée lorsque je souhaite utiliser cet indicateur : il...
Meta Signals Pro Pleasure ! Please let us know if you make good trades with it and if you see improvements we...
francis59 Bonjour, Bonjour, comment puis-je créer un screener basé sur cet indicateur, qui affiche le...
Trader Sab I am curious to try it how, however I get an error message for line 47 and 48 - drawsegment,...
Om Hello, thanks for sharing! Getting a message that Variable P is undefined?
matin Intraday Average Volume Indicator Not working, what can i do plz
Nicolas Just add it on the price series.
yomisadiku Hello Nicolas, Can I use high and low price at lines hh=max(hh,close) and ll=min(ll,close) ...
Nicolas Yes you can do that, the impact will be that the trailing stop line will be much close to th...
LucioleLucide Clean view, thanks for sharing
dertopen hi where i can found the window for candle configuration?
paolosab69 Ciao! . I have seen the pictures that explain this metod but i don't understand when is mome...
Thomas
5 years ago
Thomas Como? no intiendo. Can you write in english . It works! Download the itf file.
Thomas New Version comin soon...
CHARLESRACHELLE OLA NAO SERVE PARA MT4?
Ciccio
5 years ago
Vinks_o_7 Apirine also offers a very interesting update of the OBV...
illenza
5 years ago
ribes65 Buongiorno Illenza, Il tuo indicatore è molto efficace, ma non funziona su tutte le azion...
TACBOLSA
5 years ago
dario ti please can you help me to understand? i know i am wrong: Long Histogram = High Volume S...
TAC Bolsa hi, I have already seen the problem and requested that it be removed until an adequate so...
sixeight Hey TAC, Did you ever find a solution to this?
Vinks_o_7 b=close > low and volume > high How can we compare volume and high of the day? (orang...
TAC Bolsa If to understand something you resort to compare Oranges and bananas. You go bad, Without e...
giumagi good morning Sir, great job your indicators! How can I reach your website or blog? please..t...
Gianluca THANK YOU!!!!!
JOSEBA que relaccion tiene la numeración de las barras del 1 al 10 que tiene cada número Tengo dos...
marcov66 Hi, it seems a very useful indicator. Unfortunately the link here for the full explanation d...
TACBOLSA Discontinued indicator. we are sorry.
Azzuerus Bonjour, je teste et j'utilise vos indicateurs depuis plusieurs années, et ils me sont dev...
bremze33 Another thing. Is it possible to make the graph lines a little thicker and not so long? Be...
giumagi Hi Sir, very good job done with this indicator, May I ask you to explain what is the line VW...
pmdr1969 Hola soy nuevo en en esto. ¿Hay algo parecido pero pudiendo tu elegir las velas a a analizar...
Nicolas Add indicator on price doesnt require any specific type of subcription. Click on the wrench ...
tahiti bonjour j'ai une petite question comment peux on enlevé la bar blanche sur la bougie en cour...
sixeight Hi Kris, is there a way to increase the number of rows? I get a loop error

Top