ATR percentile rank

ATR percentile rank

The percentile rank of a score is the percentage of scores in its frequency distribution that are equal to or lower than it. For example, a test score that is greater than or equal to 75% of the scores of people taking the test is said to be at the 75th percentile, where 75 is the percentile rank. (source Wikipedia).

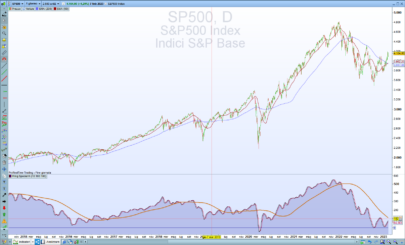
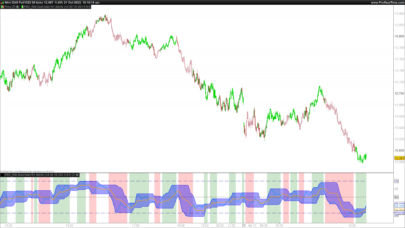
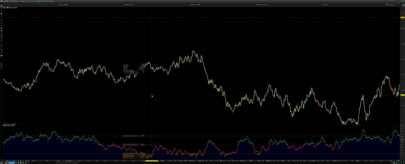
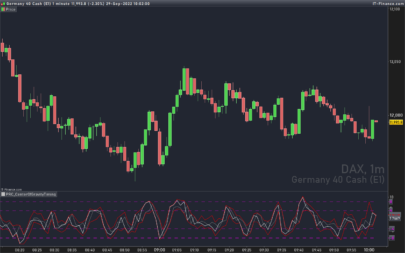
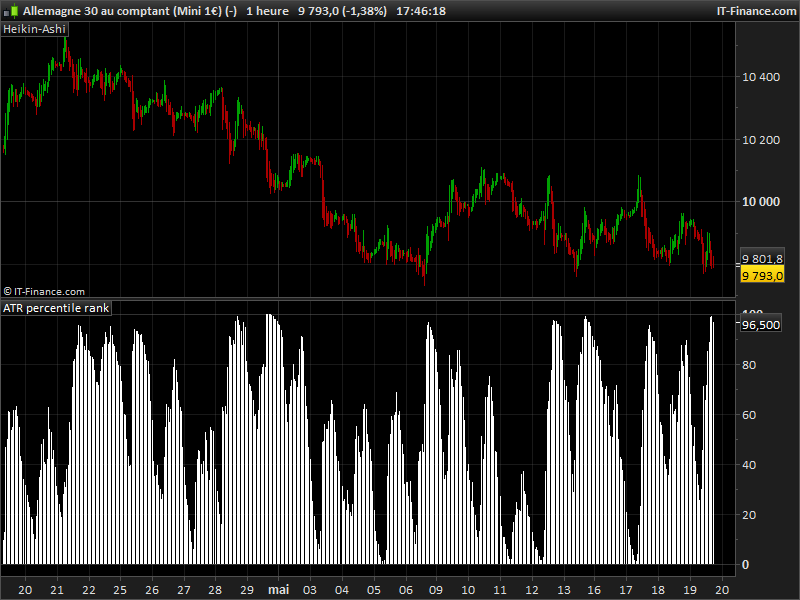
This indicator gives the percentile rank of the current Average True Range compared to the 200 periods previous ones. By comparing the recent ATR to the previous behaviour of it on the same instrument, we can have a clearer view of what the current volatility means because of its ranking in percentage. This kind of sorting formula could be adapted to any other values. 


Share this

Risk disclosure:

No information on this site is investment advice or a solicitation to buy or sell any financial instrument. Past performance is not indicative of future results. Trading may expose you to risk of loss greater than your deposits and is only suitable for experienced investors who have sufficient financial means to bear such risk.

ProRealTime ITF files and other attachments : How to import ITF files into ProRealTime platform?

PRC is also on YouTube, subscribe to our channel for exclusive content and tutorials

  1. Adolfo Onrubia • 05/19/2016 #

    Hi Nicolas!
    As far as I’m not used to use this indicator… Can you explain a bit how can we implement it in our strategies?
    Thanks in advance!

    • Nicolas • 05/19/2016 #

      This indicator rank the actual ATR to its recent statistical values. So you can have a better view of what currently happen. With this indicator you can spot a volatility increase, even if the instrument is often very fluctuant, and also spot if the instrument is in a very calm period even if its already quiet.

  2. Brisvegas • 05/19/2016 #

    Thanks Nicolas , very handy tool , I have added variables to look back period and ATR period to make it a bit more versatile . I would add ITF file if i knew how

  3. rufus.round • 05/19/2016 #

    How easy is it to remove the overnight intraday bars from the calculation?

  4. Carburo • 48 days ago #

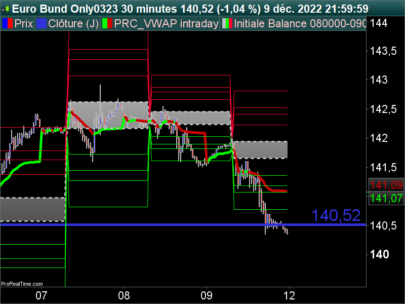
    Good morning, Nicolas. Your indicator provides information that becomes very useful when you can compare the ATR of the current bar (ATRperiod=1 or an average of your choice) with the ATR (single bar or average) of the same bar(s) from previous trading days.
    Graphically, this comparison between multiple times could be done by highlighting only those bars with consistent times, starting from the current one and working backwards, and applying a transparency color to the others. Alternatively, it could be achieved by connecting the upper ends of the bars with segments.
    Is there a way, applied to the indicator you have created, to achieve what I have tried to explain?
    The image, taken from another situation, shows both examples (please ignore the numerical data).
    I have made several attempts, but without achieving anything concrete. Such a method could be useful at an educational level to apply to other indicators.
    Thank you very much.

    [url=https://postimages.org/][img]https://i.postimg.cc/bJHnmknV/Istogramma.jpg[/img][/url]

    • Nicolas • 48 days ago #

      Please create a forum topic specific for that demand. Thank you.

avatar
Register or

Likes

avatar avatar avatar avatar avatar avatar avatar avatar avatar avatar
Related users ' posts
Alfy
3 years ago
Alfy No, the dots only show the compression of the volatility. There are 3 levels of "squeeze" wh...
ted.hulsman Hi Alfy, I'm trying to understand your indicator, so I made the Bollinger Bands and the Kelt...
davep007 I see White, Green and Red dots. I do not see Blue dots. Thanks :O)
Chrisinobi Hallo John, dein Indikator gefällt mir wirklich gut, kannst du ein Alarm mit einarbeiten auf...
JohnScher For a long time now, however, I have been involved only now and then with with popgun indica...
jonpt88 hI . THIS LOOKS GOOD. Thanks. Just one doubt: is this kind of impulse indicator - does it sh...
mfejza also, for long trailing stop d2=low d1=lowest[3](d2)+1/3*AverageTrueRange[20](close) d3=hi...
effegi
3 years ago
effegi A good alternative solution, even I had thought of the variant that uses high and low (proba...
Seb did you automate that 1-2-3 strategy? how is that working for you?
effegi Not yet, I'm busy developing other strategies/indicators at the moment, but it's on my to-do...
larouedegann Amélioration du code ............................... Je trouvais assez frustrant d'attendre...
larouedegann if TIME=081500 then valeurhaute= highest[1](high) valeurbasse= lowest[1](low) milieu = v...
magnus59 Hi Nicolas, thaks for your great work here, I need a scanner for the swedish OMX when ma...
Nicolas Yes, sure please open a new topic in the ProScreener forum section, thank you.
paullyons Hello! Thanks for post your indicators. I'd like you to let me know how to draw lines for ...
Khaled
3 years ago
DELBERT Bonjour , Nicolas , je voudrais installer cet indicateur sur ma PRT , version 10.3 , mais je...
Nicolas En effet, il faut à minima une version 11. La 10.3 est tellement ancienne maintenant.. Je pe...
DELBERT Bonjour , Nicolas , merci pour ta réponse , je fais un essai et je verrais . Salutations .
Rafa Hi Nicolas! I can´t install this indicator. it installs in a separate window not as an av...
Nicolas Add it on the price, see how: https://www.prorealcode.com/blog/video-tutorials/how-to-add-an...
Frankyslo1 No consigo instalarlo en el precio en PRL-version 10
jonpt88 This is great! Such a job you did!. I do not really understand though how it works.
Bruno Carnazzi Thank you, I've just realized that all links are missing in the description. You can find th...
Madrosat repainting as cog or not repainting?
Nicolas It doesn't repaint.
gaby IDE merci beaucoup, je l'ai mais il se place en bas avec le rsi, comment le placer au dessus sur...
Dron Gracias
Fpal Hello, thanks very much for your work. I am trying to flag when the close price is i...
Nicolas
3 years ago
KijunTrend indicator
2
Indicators
Msport71 Nicolas, buongiorno. Grazie del cortese aiuto. Buona giornata. Carlo
MaoRai54 Thanks Nicolas, it seems to work well on 1H TF on Dax. !!!
Khaled Thank you Nicolas! Looks like TDI (Trader Dynamic Index). Interesting to give Exit Signal as...
Nicolas ColorBetween is an instruction added last year: https://www.prorealcode.com/documentation/co...
finplus Bonjour, serait-il possible de remplacer l'écart formé par les bandes de Bollinger par l'ATR...
Khaled As this section of the forum is in English, I'll reply in English. I'm using PRT v11, so I d...
sal157011 Don't understand where it says: "Volume Pressure Histogram: Columns plotted in positive are ...
Khaled Not sure to understand the question. However, the columns (Histogram) represent the variable...
Jiacky
3 years ago
Kalman Filter
Kalman Filter
0
Indicators

Top