







Hurst Exponent - Detrended Fluctuation Analysis
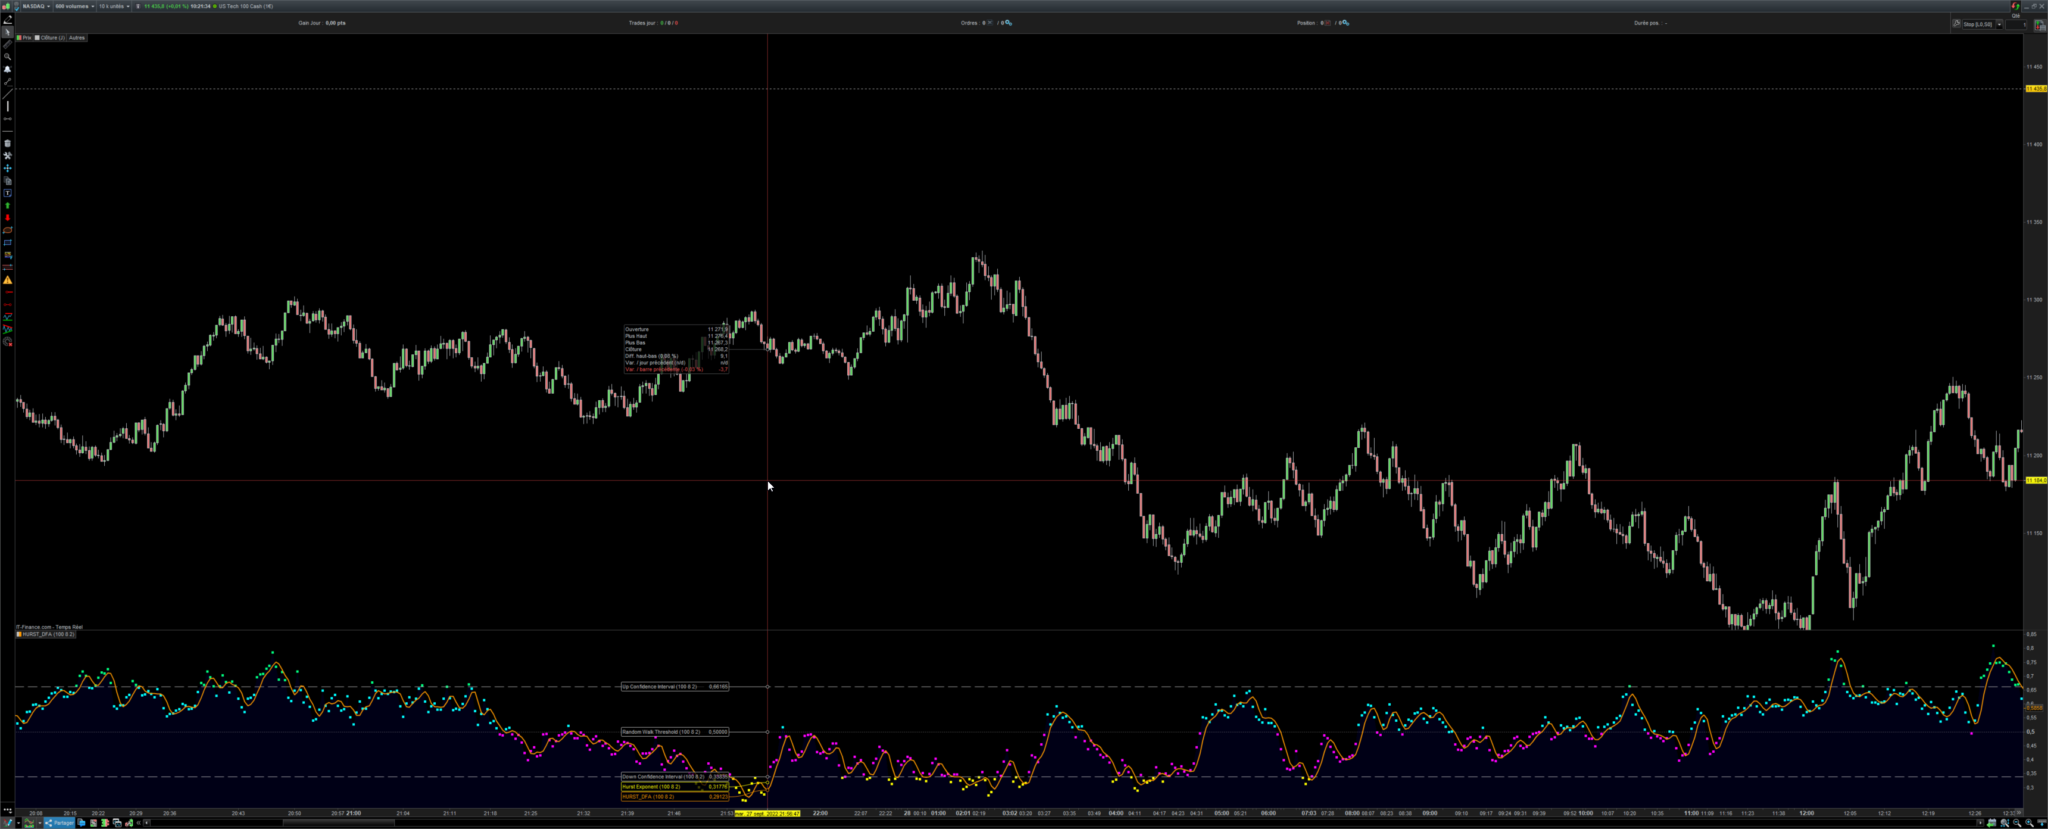
This is the port to PRT of the nice balipour indicator from tradingview.
In stochastic processes, chaos theory and time series analysis, detrended fluctuation analysis (DFA) is a method for determining the statistical self-affinity of a signal. It is useful for analyzing time series that appear to be long-memory processes and noise.
WARNING : this indicator will hit your CPU very hard. It was a test drive for me to test the limit of ProBuilder. I don’t recommend using it in real time.
For practical and intuitive indicators, you can have a look at my ProRealCode Market store.
//defparam calculateonlastbars = 2000

// Params
 len: 100
 bsc: 8
 msc: 2

//Log Return
r = log(close / close[1])

//Mean of Log Return
mean = average[len](r)

//Cumulative Sum
sum = 0
for i = 0 to len - 1 do
sum = (r[i] - mean) + sum
$csum[i] = sum
next

// Approximating log scale function (save sample size)
for i = 0 to 9 do
$fs[i] = round(bsc*pow(pow(len/(msc*bsc),0.1111111111),i))
next

for i = 0 to 9 do
//Average of Root Mean Sum Measured each block (Log Scale) ARMS
bar = $fs[i]
num = floor(len / bar)
sumr = 0
for j = 0 to num - 1 do
//Root Mean Sum (FLuctuation) function linear trend to calculate error between linear trend and cumulative sum
rms = 0
count = 0
N1 = j * bar
N  = bar

//Slicing the array into different segments
for k = 0 to N - 1 do
count = count + 1
$seq[k] = count
next

for k = N1 to N1 + N - 1 do
$y[k - N1] = $csum[k]
next

//Linear regression measuing trend (N/(N-1) for sample unbiased adjustedment)
ec = 0
for k = 0 to N - 1 do
ec = ec + $seq[k]
next
mc = ec / N

varx = 0
for k = 0 to N - 1 do
varx = varx + square($seq[k] - mc)
next
sdx = sqrt(varx/N) * sqrt(N/(N-1))

ey = 0
for k = 0 to N - 1 do
ey = ey + $y[k]
next
my = ey / N

vary = 0
for k = 0 to N - 1 do
vary = vary + square($y[k] - my)
next
sdy = sqrt(vary/N) * sqrt(N/(N-1))

esy = 0
for k = 0 to N - 1 do
esy = esy + $seq[k] * $y[k]
next
msy = esy / N

cov = (msy - mc * my) * (N/(N-1))

rr2 = pow(cov/(sdx*sdy), 2)
rms = sqrt(1 - rr2) * sdy

sumr = sumr + rms
next

$fluc[i] = log(sumr / num) / log(10)
next

//Set Ten Points of data scale along the X log axis
for i = 0 to 9 do
$scl[i] = log($fs[i]) / log(10)
next

// Slope Measured from RMS and scale on log log plot using linear regression
ssc = 0
for i = 0 to 9 do
ssc = ssc + $scl[i]
next
esc = ssc / 10

sfl = 0
for i = 0 to 9 do
sfl = sfl + $fluc[i]
next
efl = sfl / 10

sf = 0
for i = 0 to 9 do
sf = sf + ($scl[i] - esc) * ($fluc[i] - efl)
next
cov = sf / 10

ssq = 0
for i = 0 to 9 do
ssq = ssq + square($scl[i] - esc)
next
var = ssq / 10

hurst = cov / var

//Critical Value based on Confidence Interval (95% Confidence)
ci = 1.645 * (0.3912 / pow(len,0.3))
//Expected Value plus Crtical Value
cu = 0.5 + ci
cd = 0.5 - ci

if hurst > cu then
hr = 0
hg = 255
hb = 128
elsif hurst >= 0.5 then
hr = 0
hg = 255
hb = 255
elsif hurst < cd then
hr = 255
hg = 255
hb = 0
elsif hurst < 0.5 then
hr = 255
hg = 0
hb = 255
endif

smooth = (hurst + 2 * hurst[1] + 2 * hurst[2] + hurst[3]) / 6

return hurst coloured(hr, hg, hb) style(point, 3) as "Hurst Exponent", cu as "Up Confidence Interval", cd as "Down Confidence Interval", 0.5 as "Random Walk Threshold", smooth
Comments
You must be logged in to post a comment.
Thank you, I've just realized that all links are missing in the description. You can find the original indicator and explanations here : https://www.tradingview.com/script/vTloluai-Hurst-Exponent-Detrended-Fluctuation-Analysis-pig/ and my store here : https://market.prorealcode.com/store/digital-filters-workshop/
This is great! Such a job you did!. I do not really understand though how it works.