







ATR percentile rank
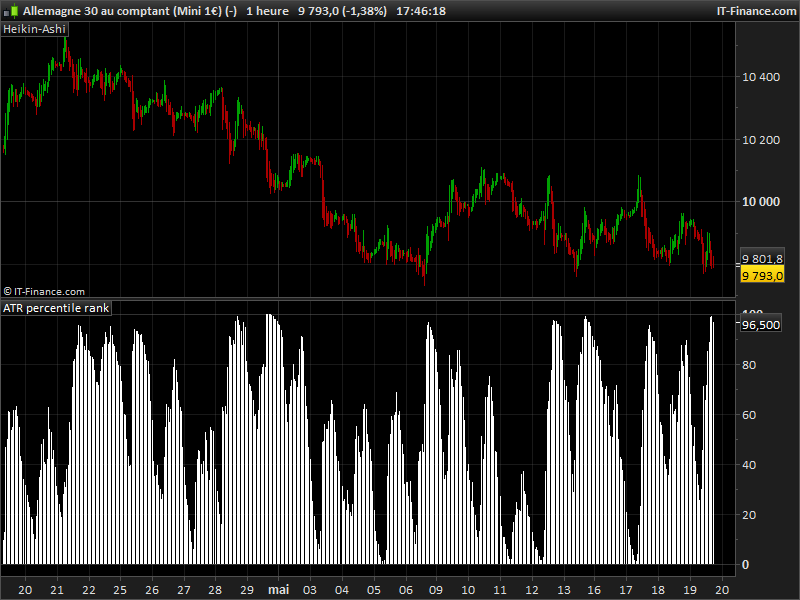
The percentile rank of a score is the percentage of scores in its frequency distribution that are equal to or lower than it. For example, a test score that is greater than or equal to 75% of the scores of people taking the test is said to be at the 75th percentile, where 75 is the percentile rank. (source Wikipedia).
This indicator gives the percentile rank of the current Average True Range compared to the 200 periods previous ones. By comparing the recent ATR to the previous behaviour of it on the same instrument, we can have a clearer view of what the current volatility means because of its ranking in percentage. This kind of sorting formula could be adapted to any other values.
ATRPctRkLookback = 200
ATRperiod = 20

rnkCount = 0

ATR = averagetruerange[ATRperiod](close)

FOR i = 1 TO ATRPctRkLookback DO
 IF ATR > ATR[i] THEN
  rnkCount = rnkCount + 1
 endif
NEXT

ATRPctRank = 100 * rnkCount / ATRPctRkLookback

RETURN ATRPctRank
No files found.
Comments
You must be logged in to post a comment.

How easy is it to remove the overnight intraday bars from the calculation?


Hi Nicolas!
As far as I'm not used to use this indicator... Can you explain a bit how can we implement it in our strategies?
Thanks in advance!
This indicator rank the actual ATR to its recent statistical values. So you can have a better view of what currently happen. With this indicator you can spot a volatility increase, even if the instrument is often very fluctuant, and also spot if the instrument is in a very calm period even if its already quiet.
Good morning, Nicolas. Your indicator provides information that becomes very useful when you can compare the ATR of the current bar (ATRperiod=1 or an average of your choice) with the ATR (single bar or average) of the same bar(s) from previous trading days. Graphically, this comparison between multiple times could be done by highlighting only those bars with consistent times, starting from the current one and working backwards, and applying a transparency color to the others. Alternatively, it could be achieved by connecting the upper ends of the bars with segments. Is there a way, applied to the indicator you have created, to achieve what I have tried to explain? The image, taken from another situation, shows both examples (please ignore the numerical data). I have made several attempts, but without achieving anything concrete. Such a method could be useful at an educational level to apply to other indicators. Thank you very much. [url=https://postimages.org/][img]https://i.postimg.cc/bJHnmknV/Istogramma.jpg[/img][/url]