The Relative Strength Index (RSI) is a popular momentum indicator used in technical analysis to measure the strength of an asset’s price action. Typically, traders use RSI to identify potential buying or selling opportunities in the market. In this blog post, we’ll be discussing a unique indicator code that uses different sets of data to calculate three different RSI indicators simultaneously.
The code utilizes three data sets – high minus close[1], close minus close[1], and low minus close[1]. These sets of data are calculated using the previous day’s high, close, and low values. The calculation of these data sets is essential in generating three different RSI values.
The RSI indicator is calculated using the following formula: RSI = 100 – [100 / (1 + RS)]. RS is the average gain of up periods divided by the average loss of down periods over a specified period. The period used in the calculation can vary depending on the user’s preference.
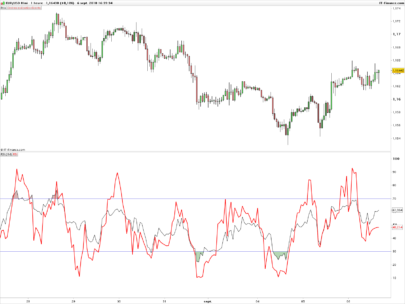
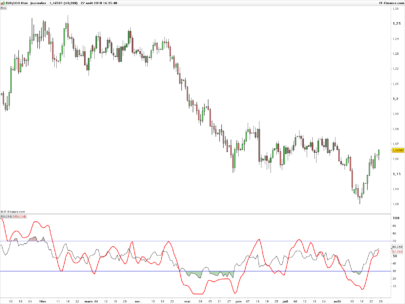
The first RSI value is calculated using the high minus close[1] data set. This RSI indicator focuses on the strength of upward price movement. When the RSI value is above 70, it indicates that the asset is overbought and may experience a price correction in the near future. On the other hand, an RSI value below 30 indicates that the asset is oversold and may experience a price increase soon.
The second RSI value is calculated using the close minus close[1] data set. This RSI indicator focuses on the strength of the asset’s overall price movement. When the RSI value is above 50, it indicates that the asset’s price is trending upwards. Conversely, an RSI value below 50 indicates that the asset’s price is trending downwards.
The third and final RSI value is calculated using the low minus close[1] data set. This RSI indicator focuses on the strength of downward price movement. When the RSI value is above 70, it indicates that the asset is oversold, and a price correction may occur soon. On the other hand, an RSI value below 30 indicates that the asset is overbought, and a price increase may occur soon.
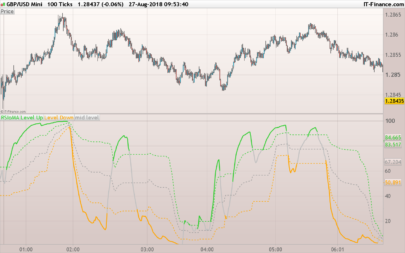
Using this unique RSI indicator code, traders can have a more comprehensive understanding of the strength of an asset’s price action. By simultaneously monitoring the three different RSI values, traders can identify potential buying or selling opportunities based on their individual trading strategies.
In conclusion, the RSI indicator is a valuable tool in technical analysis, and this unique indicator code that uses different sets of data to calculate three different RSI indicators simultaneously is a great way to get a comprehensive understanding of an asset’s price action. Whether you’re a beginner or an experienced trader, this code can help you make informed trading decisions.
|
1 2 3 4 5 6 7 8 9 10 11 12 13 14 15 16 17 18 19 20 21 22 23 24 25 26 27 28 29 30 31 32 33 34 35 36 37 38 39 40 41 42 |
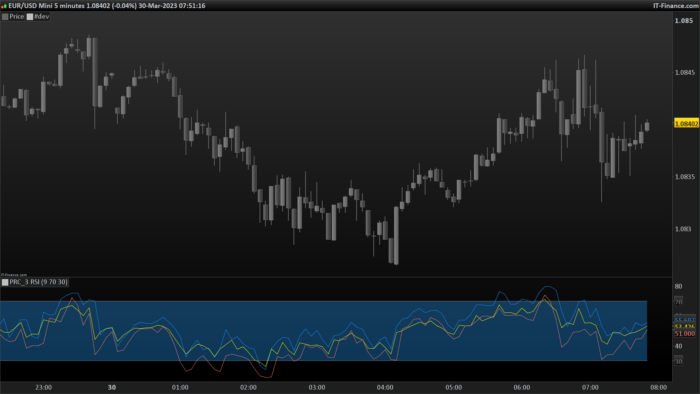
//PRC_3 RSI | indicator //30.03.2023 //Nicolas @ www.prorealcode.com //Sharing ProRealTime knowledge //author: buildorbustmail // --- settings inpPeriod = 9 OverBought = 70 OverSold = 30 // --- end of settings once alpha=1.0/max(inpPeriod,1) iRSI=rsi[inpPeriod] once FLTMIN=ticksize if barindex>inpPeriod then diff = high - close[1] ChangeHigh = ChangeHigh[1] + alpha*(diff - ChangeHigh[1]) ChangaHigh = ChangaHigh[1] + alpha*(abs(diff) - ChangaHigh[1]) RSIHigh = 50.0*(ChangeHigh/max(ChangaHigh,FLTMIN)+1) diff = close - close[1] ChangeHigh = ChangeHigh[1] + alpha*(diff - ChangeHigh[1]) ChangaHigh = ChangaHigh[1] + alpha*(abs(diff) - ChangaHigh[1]) diff = low - close[1] ChangeLow = ChangeLow[1] + alpha*(diff - ChangeLow[1]) ChangaLow = ChangaLow[1] + alpha*(abs(diff) - ChangaLow[1]) RSILow = 50.0*(ChangeLow/max(ChangaLow,FLTMIN)+1) diff = close - close[1] ChangeLow = ChangeLow[1] + alpha*(diff - ChangeLow[1]) ChangaLow = ChangaLow[1] + alpha*(abs(diff) - ChangaLow[1]) colorbetween(overbought,oversold,33, 150, 243, 90) endif RETURN RSIHigh as "RSI High" coloured(30,144,255), RSI as "High" coloured("yellow"), RSILow as "RSI Low" coloured(250,128,114),overbought coloured(120, 123, 134), oversold coloured(120, 123, 134) |
Share this
No information on this site is investment advice or a solicitation to buy or sell any financial instrument. Past performance is not indicative of future results. Trading may expose you to risk of loss greater than your deposits and is only suitable for experienced investors who have sufficient financial means to bear such risk.
ProRealTime ITF files and other attachments :
Find other exclusive trading pro-tools on ![]()
PRC is also on YouTube, subscribe to our channel for exclusive content and tutorials


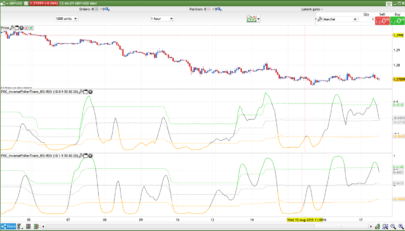


Nicolas, you calculate iRSI, but don’t use it. You show RSI in the returned values, which, after all, happens to be the same.
Moreover, when studying the three RSI values, then two additional conditions stand out:
One, if RSIHigh dives below RSI (yellow), the middle value, an oversold condition gets flagged.
Two, if RSILow jumps above RSI, the middle value, then an overbought condition is indicated.
Yes, that’s an error. RSI instruction is set by default to 14 if you don’t indicate it that’s why it looks the same. The last line should be:
RETURN RSIHigh as “RSI High” coloured(30,144,255), iRSI as “High” coloured(“yellow”), RSILow as “RSI Low” coloured(250,128,114),overbought coloured(120, 123, 134), oversold coloured(120, 123, 134)