

MODA Indicator for graphical statistics
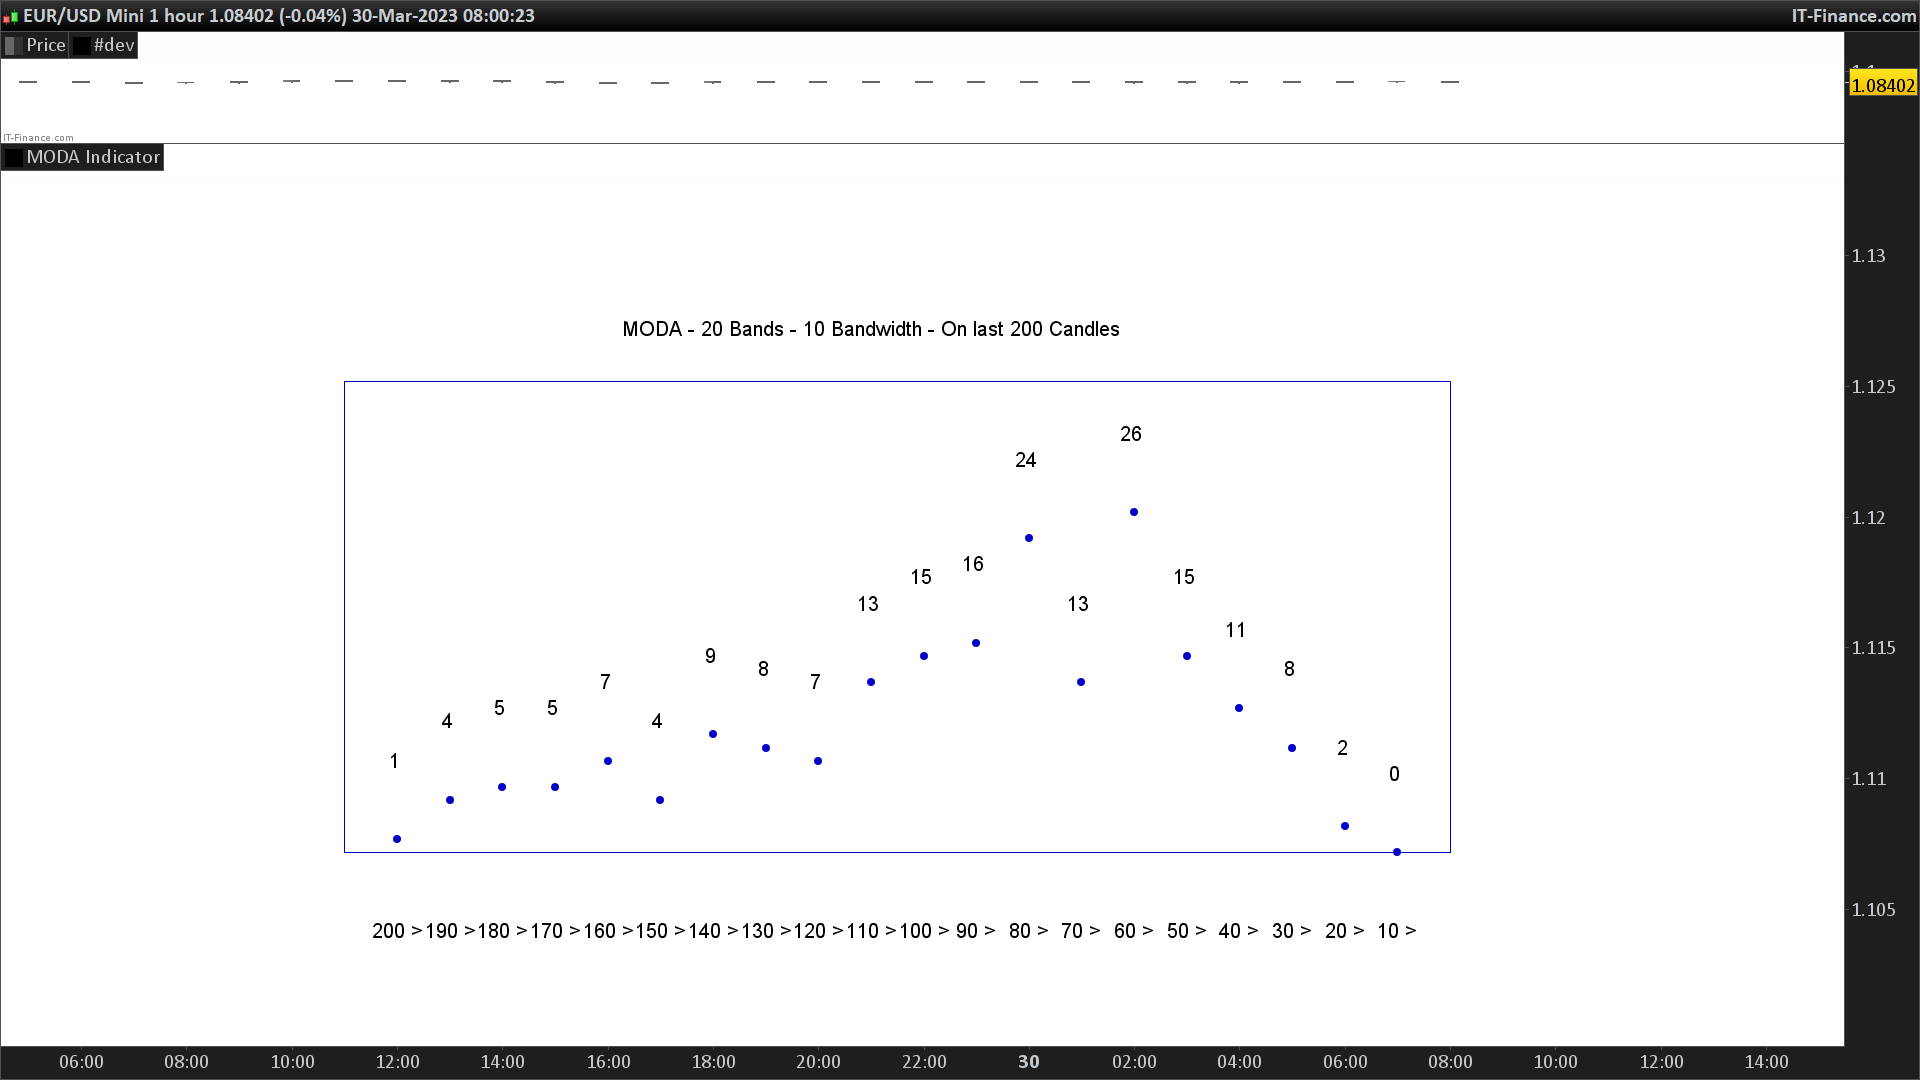
Hi. For those who may be interested, I share this simple code to graphically analyze the distribution of the values of some variable of interest, which I find useful when researching settings parameters for indicators or trading systems.
I’m not a mathematician, but I was looking for something equivalent to MODA that could help to make statistics quickly, giving an immediate idea of the frequency with which certain values occur. It can only be used for NORMALIZED values and little for absolute values (positive values>0)
I excluded candle 0 from the calculation as it is still in formation. To go beyond 500 candles modify CalculateOnLastBars.
Enter the variable of interest as a VIA in the desired timeframe (e.g., the distribution of the difference between the close and its 50-period average, the value of the stochastic, etc.)
Unfortunately the buttons to insert the file code and the screenshots don’t work.
//T.F. 27-03-2023 - MODA Indicator
//Sharing on ProRealCode
DEFPARAM CalculateOnLastBars = 500
DEFPARAM DRAWONLASTBARONLY = true

//Parameters:
CDB=200  //Candle Back
NOB=20   //Number Of Bands
BW=10    //Band Width
VZOOM=5  //Vertical Zoom - for graphics only

//Variable in Analysis - 1
rangeD=range
AtrD=AverageTrueRange[14](close)
rangeP=rangeD/atrD*100

//Variable in Analysis - 2
myrsi=RSI[14](close)[1]


//MODA
VIA=Rangep //Variable in analysis - 1
rem VIA=myrsi //Variable in analysis - 2

offset=Highest[30](high)+200*pipsize //for graphics only
MaxCOVINB=0 //for graphics only

if dayofweek=currentdayofweek then //to reduce calculation time
for i=1 to NOB do
COVINB=0 //Count Of Values in Band
for z=1 to CDB do
if VIA[z]>=(BW*(i-1)) and VIA[z]<(BW*i) then
COVINB=COVINB+1
endif
next
bwx=BW*i //for graphics only
drawpoint(barindex-i,COVINB*pipsize*VZOOM+offset,2) coloured(0,0,200)  //Y point
drawtext("#COVINB#",barindex-i,COVINB*pipsize*VZOOM+30*pipsize+offset) //Y value
drawtext("#BWx#>",barindex-i,offset-30*pipsize) //X scale
If COVINB>MaxCOVINB THEN //for graphics only
MaxCOVINB=COVINB
ENDIF
next
drawrectangle (barindex,offset,barindex-NOB-1,MaxCOVINB*pipsize*VZOOM+50*pipsize+offset) coloured(0,0,200)
drawtext ("MODA - #NOB#Bands - #BW#Bandwidth - On last #CDB#Candles", barindex-round(NOB/2)-1,MaxCOVINB*pipsize*VZOOM+70*pipsize+offset)
//Value Table for OCR - Optional
for i=1 to CDB do
xx=round(via[i],1)
drawtext ("C#i#= #xx#", barindex,low-i*20*pipsize-10*pipsize)
next
endif

return