This indicator is a modified version of my 1-2-3 Pivots Support and Resistance Lines indicator that can be found here:
https://www.prorealcode.com/prorealtime-indicators/1-2-3-pivots-support-and-resistance-lines/
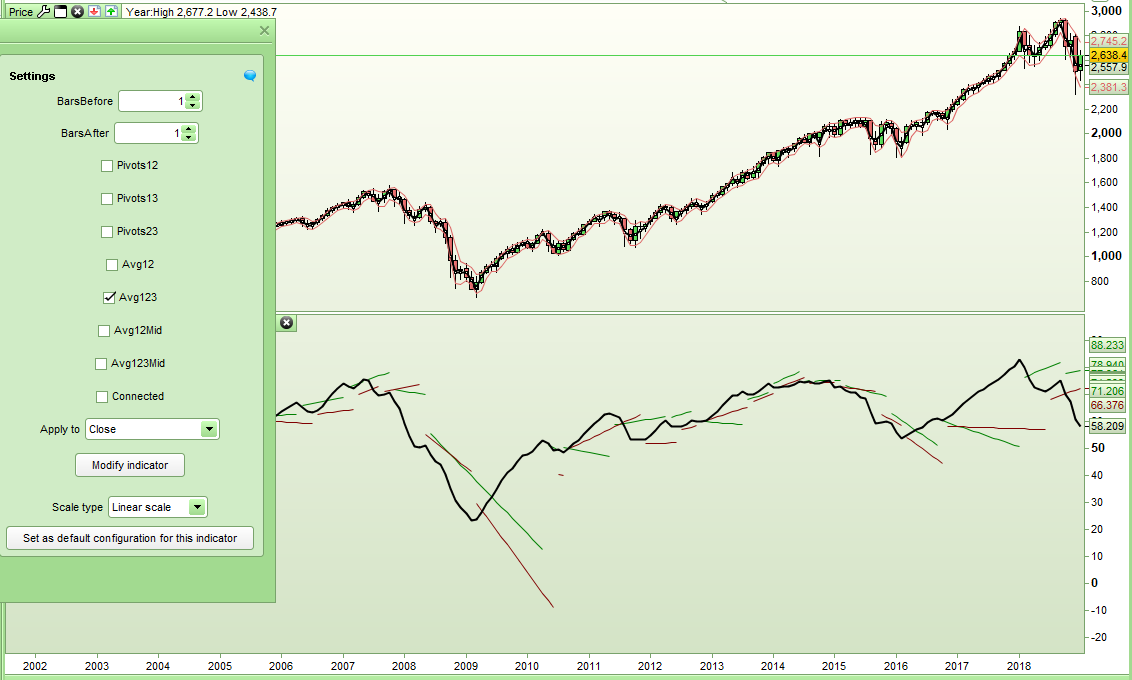
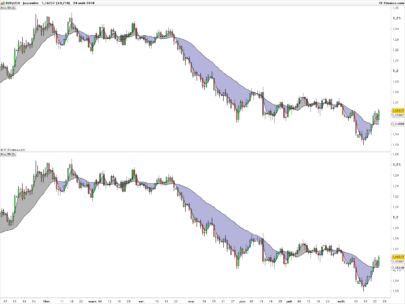
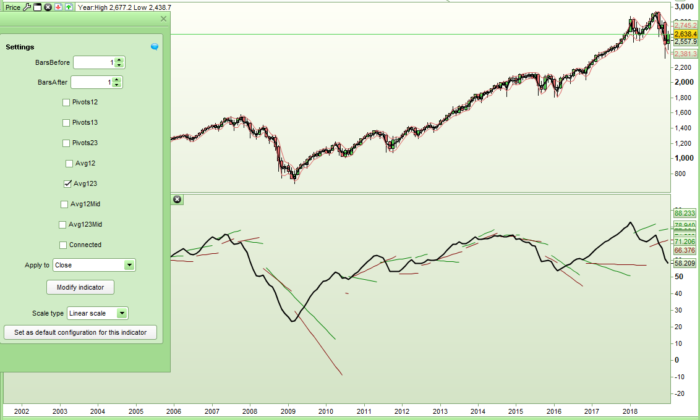
This new version allows you to plot the support and resistance lines (and the averages of them) that are based on the last three high and last three low points of an indicator. Just change the indicator in line 18 to the indicator of your choice. In the example here it is a fast average of RSI[14] but if you want a different indicator then change it to MyIndicator = Stochastic[5,10] for example.
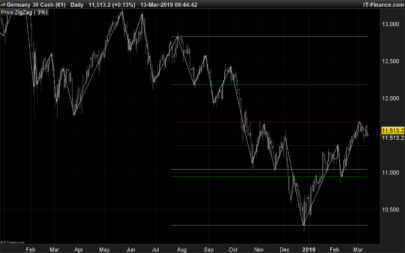
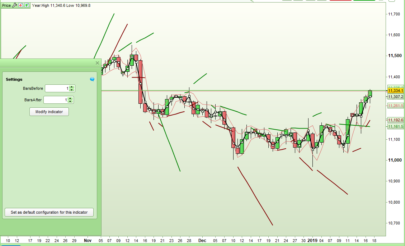
Whenever a new pivot point is formed a new support or resistance lines start to be drawn that line up with previous high and low pivot points.
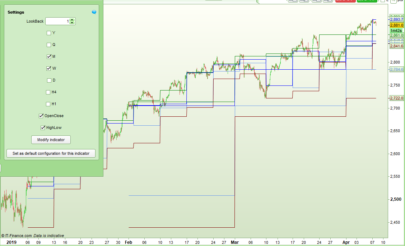
The last three swing highs and last three swing lows are used. By ticking or unticking the relevant box various support and resistance lines can be displayed or removed as follows:
- Pivots12 – Lines that are a continuation of a line connecting the last two high and low pivots.
- Pivots13 – Lines that are a continuation of a line connecting the last and the second to last high and low pivots.
- Pivots23 – Lines that are a continuation of a line connecting the second to last and third to last high and low pivots.
- Avg12 – Lines that are an average of the Pivots12 and Pivots13 lines.
- Avg123 – Lines that are an average of the Pivots12, Pivots13 and Pivots23 lines.
- Avg12Mid – A line that is mid way between the Avg12 support and resistance lines.
- Avg123Mid – A line that is mid way between the Avg123 support and resistance lines.
- Connected – All lines are drawn connected when a new pivot high or pivot low is formed
The pivot definition can be adjusted by changing the number of bars before and the number of bars after the high or low. So for example you can have a new pivot whenever a high has one candle lower either side of it or when it has two candles lower either side of it.
Breakout of support and resistance lines by an indicator can indicate a change of direction or the start of a new trend. The slope of the lines can be used to spot divergence between an indicator and price.
I advise downloading the ITF and importing it to your platform to get full functionality.
|
1 2 3 4 5 6 7 8 9 10 11 12 13 14 15 16 17 18 19 20 21 22 23 24 25 26 27 28 29 30 31 32 33 34 35 36 37 38 39 40 41 42 43 44 45 46 47 48 49 50 51 52 53 54 55 56 57 58 59 60 61 62 63 64 65 66 67 68 69 70 71 72 73 74 75 76 77 78 79 80 81 82 83 84 85 86 87 88 89 90 91 92 93 94 95 96 97 98 99 100 101 102 103 104 105 106 107 108 109 110 111 112 113 114 115 116 117 118 119 120 121 122 123 124 125 126 127 128 129 130 131 132 133 134 135 136 137 138 139 140 141 142 143 144 145 146 147 148 149 150 151 152 153 154 155 156 157 158 159 160 161 162 163 164 165 166 167 168 169 170 171 172 173 174 |
//Pivots123 Support and Resistance Lies On Indicator //By Vonasi //20190123 //DEFPARAM CalculateOnLastBars = 1000 //BarsAfter = 1 //BarsBefore = 1 //Pivots12 = 1 //Pivots13 = 1 //Pivots23 = 1 //Avg12 = 1 //Avg123 = 1 //Avg12Mid = 1 //Avg123 = 1 //Connected = 1 MyIndicator = exponentialaverage[5](RSI[14](customclose)) // Replace the indicator here with the indicator of your choice. BarLookBack = BarsAfter + 1 IF MyIndicator[BarsAfter] < lowest[BarsBefore](MyIndicator)[BarLookBack] THEN IF MyIndicator[BarsAfter] = lowest[BarLookBack](MyIndicator) THEN Support = MyIndicator[BarsAfter] ENDIF ENDIF IF MyIndicator[BarsAfter] > highest[BarsBefore](MyIndicator)[BarLookBack] THEN IF MyIndicator[BarsAfter] = highest[BarLookBack](MyIndicator) THEN Resistance = MyIndicator[BarsAfter] ENDIF ENDIF cr12 = 0 cr13 = 0 cr23 = 0 cs12 = 0 cs13 = 0 cs23 = 0 csave3 = 0 crave3 = 0 csave2 = 0 crave2 = 0 cave3mid = 0 cave2mid = 0 if pivots12 then cr12 = 255 cs12 = 255 endif if pivots13 then cr13 = 255 cs13 = 255 endif if pivots23 then cr23 = 255 cs23 = 255 endif if avg123 then crave3 = 255 csave3 = 255 endif if avg12 then crave2 = 255 csave2 = 255 endif if avg123mid then cave3mid = 255 endif if avg12mid then cave2mid = 255 endif if resistance <> resistance[1] then hi3 = hi2 hi2 = hi1 hi3index = hi2index hi2index = hi1index hi1 = MyIndicator[BarsAfter] hi1index = BarIndex[BarsAfter] if not connected then cr12 = 0 cr13 = 0 cr23 = 0 crave3 = 0 crave2 = 0 cave2mid = 0 cave3mid = 0 endif endif if support <> support[1] then lo3 = lo2 lo2 = lo1 lo3index = lo2index lo2index = lo1index lo1 = MyIndicator[BarsAfter] lo1index = BarIndex[BarsAfter] if not connected then cs12 = 0 cs13 = 0 cs23 = 0 csave3 = 0 csave2 = 0 cave2mid = 0 cave3mid = 0 endif endif //12 if hi2 > hi1 then nexthi12 = hi1 - (((hi2 - hi1) / (hi1index - hi2index)) * (barindex - hi1index)) endif if hi2 < hi1 then nexthi12 = hi1 + (((hi1 - hi2) / (hi1index - hi2index)) * (barindex - hi1index)) endif if lo2 > lo1 then nextlo12 = lo1 - (((lo2 - lo1) / (lo1index - lo2index)) * (barindex - lo1index)) endif if lo2 < lo1 then nextlo12 = lo1 + (((lo1 - lo2) / (lo1index - lo2index)) * (barindex - lo1index)) endif //13 if hi3 > hi1 then nexthi13 = hi1 - (((hi3 - hi1) / (hi1index - hi3index)) * (barindex - hi1index)) endif if hi3 < hi1 then nexthi13 = hi1 + (((hi1 - hi3) / (hi1index - hi3index)) * (barindex - hi1index)) endif if lo3 > lo1 then nextlo13 = lo1 - (((lo3 - lo1) / (lo1index - lo3index)) * (barindex - lo1index)) endif if lo3 < lo1 then nextlo13 = lo1 + (((lo1 - lo3) / (lo1index - lo3index)) * (barindex - lo1index)) endif //23 if hi3 > hi2 then nexthi23 = hi2 - (((hi3 - hi2) / (hi2index - hi3index)) * (barindex - hi1index)) endif if hi3 < hi2 then nexthi23 = hi2 + (((hi2 - hi3) / (hi2index - hi3index)) * (barindex - hi1index)) endif if lo3 > lo2 then nextlo23 = lo2 - (((lo3 - lo2) / (lo2index - lo3index)) * (barindex - lo1index)) endif if lo3 < lo2 then nextlo23 = lo2 + (((lo2 - lo3) / (lo2index - lo3index)) * (barindex - lo1index)) endif nextloave3 = (nextlo12 + nextlo13 + nextlo23)/3 nexthiave3 = (nexthi12 + nexthi13 + nexthi23)/3 nextloave2 = (nextlo12 + nextlo13)/2 nexthiave2 = (nexthi12 + nexthi13)/2 ave123mid = (nexthiave3 + nextloave3)/2 ave12mid = (nexthiave2 + nextloave2)/2 RETURN nexthi12 coloured(0,128,0,cr12) style(line,1) as "Resistance12", nextlo12 coloured (128,0,0,cs12) style(line,1) as "Support12", nexthi13 coloured(0,128,0,cr13) style(line,1) as "Resistance13", nextlo13 coloured (128,0,0,cs13) style(line,1) as "Support13", nexthi23 coloured(0,128,0,cr23) style(line,1) as "Resistance23", nextlo23 coloured (128,0,0,cs23) style(line,1) as "Support23", nexthiave3 coloured(0,128,0,crave3) style(line,1) as "Resistance Average 1-2-3", nextloave3 coloured (128,0,0,csave3) style(line,1) as "Support Average 1-2-3", nexthiave2 coloured(0,128,0,crave2) style(line,1) as "Resistance Average 1-2", nextloave2 coloured (128,0,0,csave2) style(line,1) as "Support Average 1-2", ave123mid coloured (0,0,255,cave3mid) style(line,1) as "Average Mid 1-2-3", ave12mid coloured (0,0,255,cave2mid) style(line,1) as "Average Mid 1-2", MyIndicator style(line,2) as "My Indicator" |
Share this
No information on this site is investment advice or a solicitation to buy or sell any financial instrument. Past performance is not indicative of future results. Trading may expose you to risk of loss greater than your deposits and is only suitable for experienced investors who have sufficient financial means to bear such risk.
ProRealTime ITF files and other attachments :
Find other exclusive trading pro-tools on ![]()
PRC is also on YouTube, subscribe to our channel for exclusive content and tutorials