It’s daft really as on manual trades I can open 5 trades separately and then close 5 separately.
Yes but you can’t do it as fast as an automatic strategy could which is perhaps why a certain broker is quite happy to not let you do it. They need to balance their books against every trade and every potential profit or loss and they perhaps prefer things to be happening a little slower so that they can do that?
Just sharing pics with the exact number of bars
So are your charts proving that we can expect to get only …
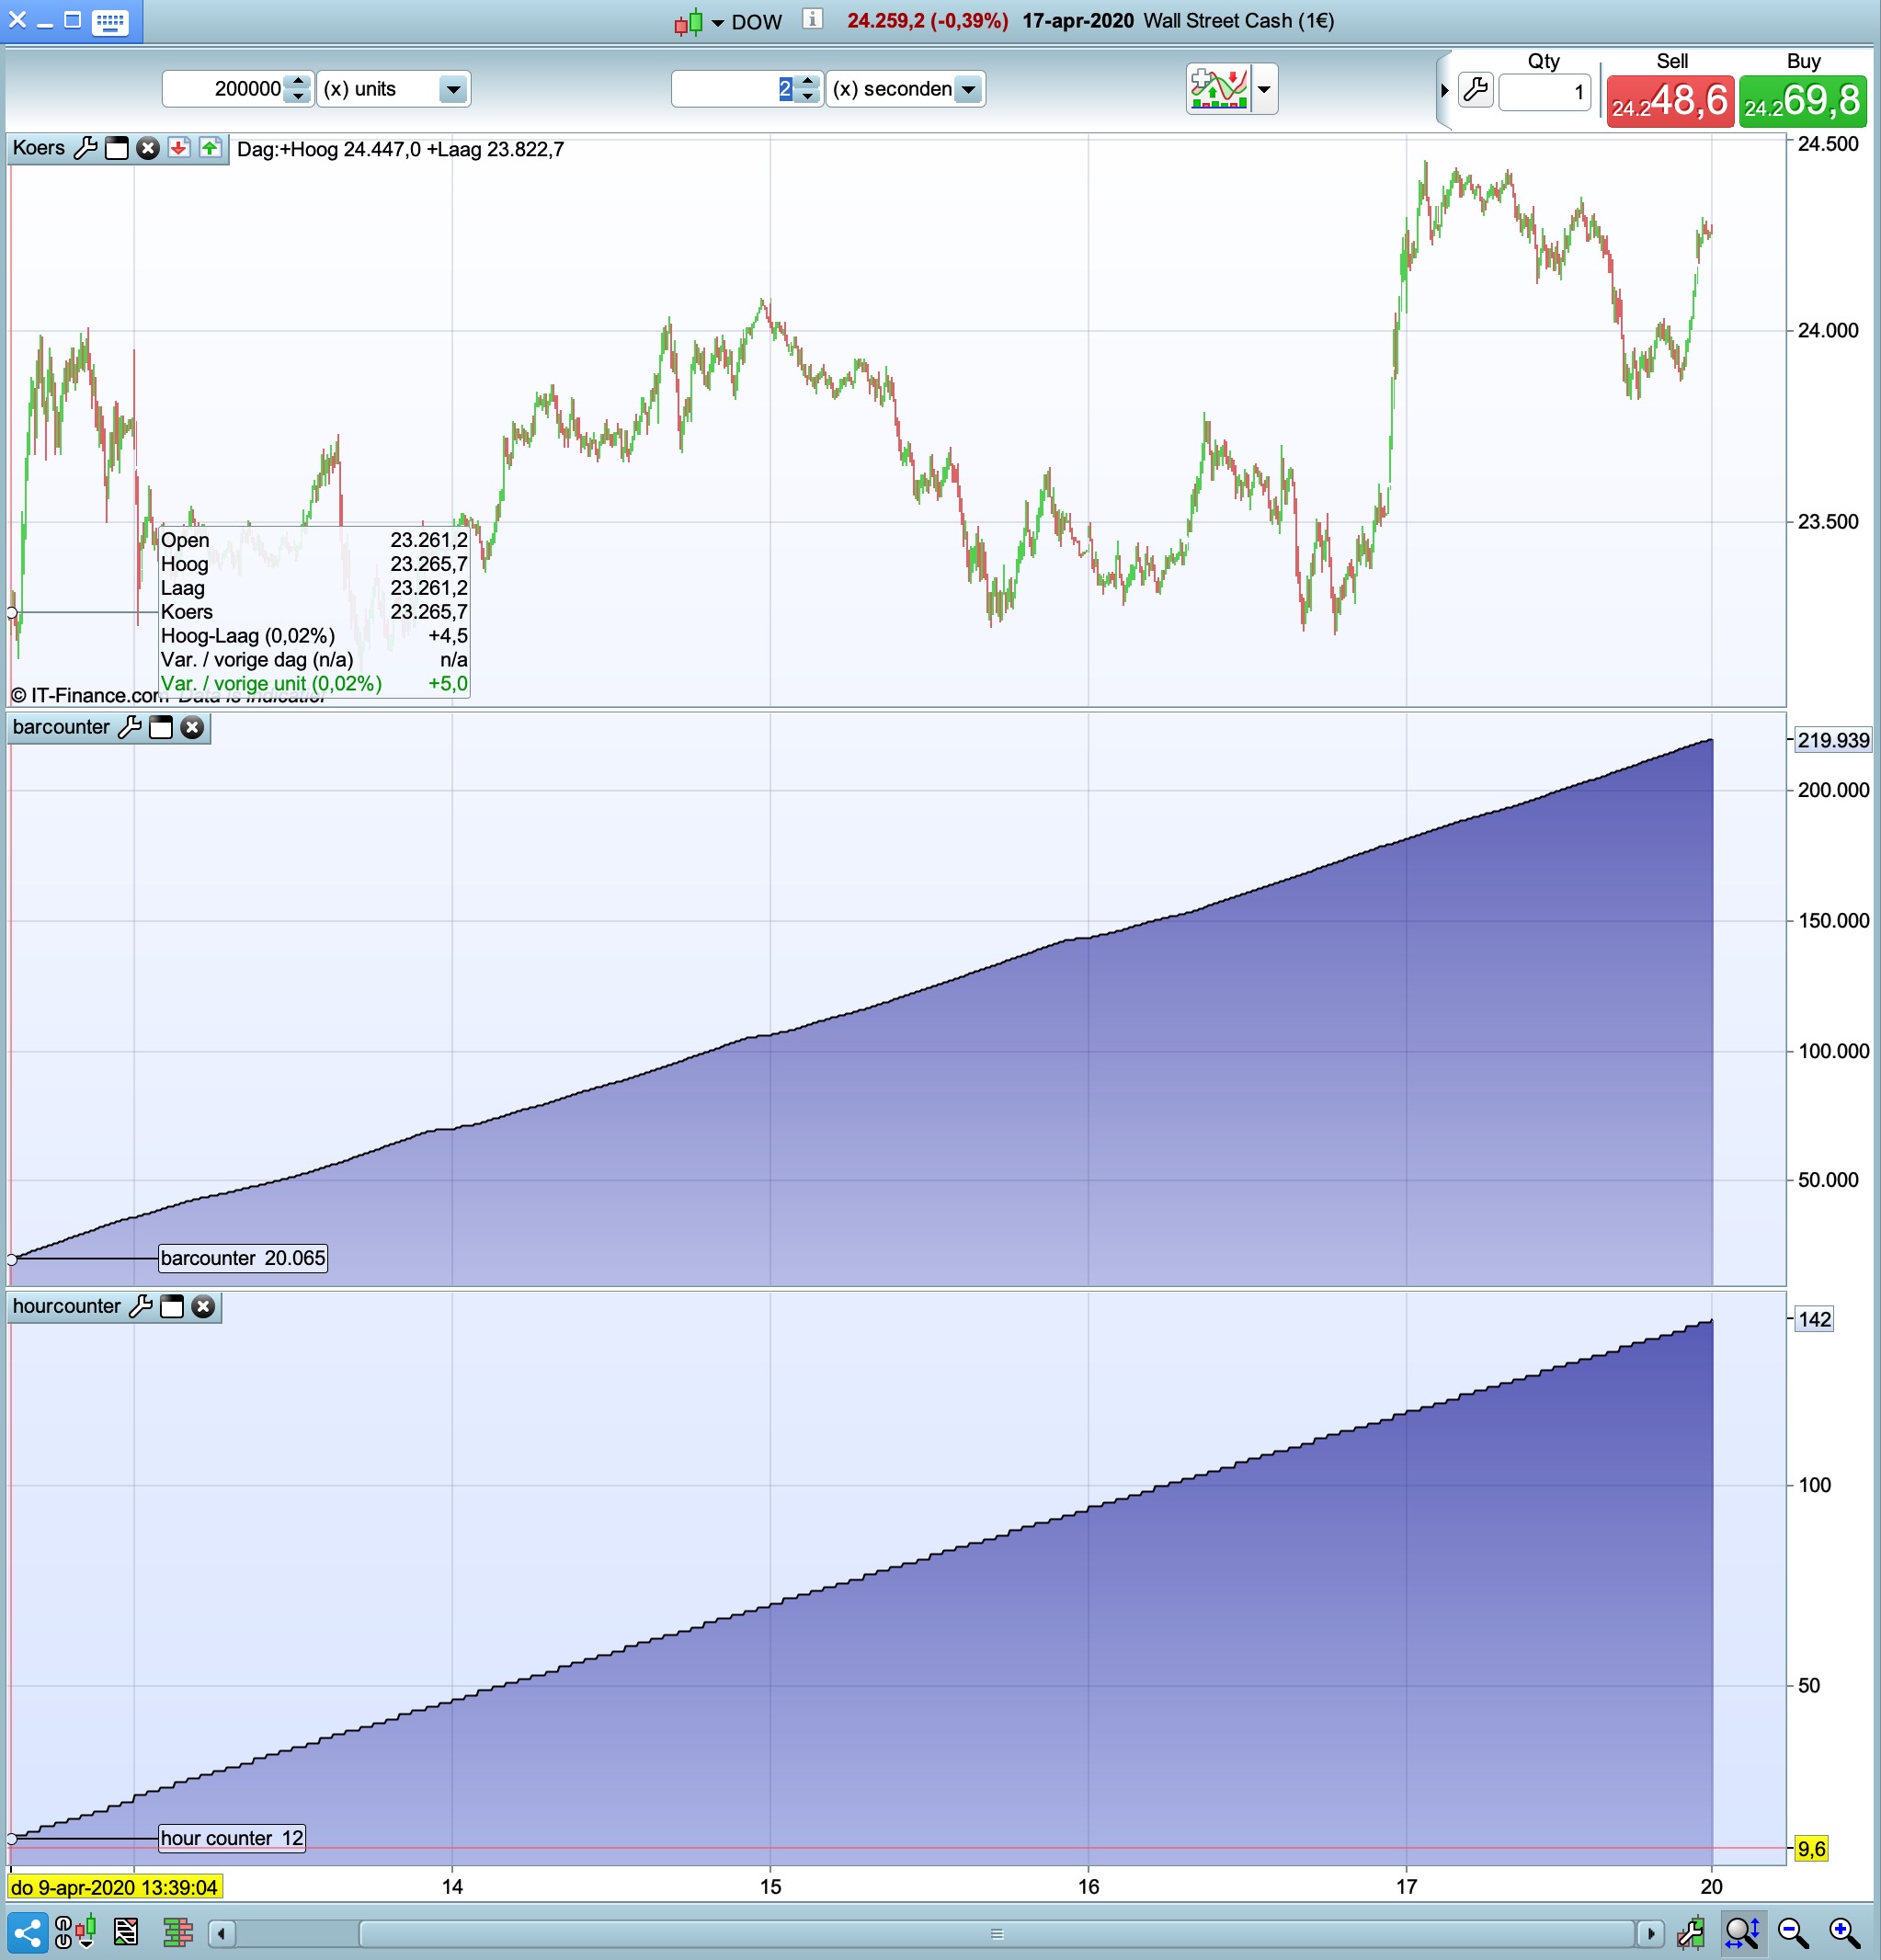
2 sec TF – 151,385 bars over a 200k bars period?
1 sec TF – 165,877 bars over a 200k bars period?
I think it’s 200.499 for 1 sec and 219.939 for 2 sec?
The numbers that you said it’s just where he left the cursor while taking the screenshots?
The numbers that you said it’s just where he left the cursor while taking the screenshots?
I thought that at first, but it can’t be surely as both points would be 3/4 ish along the horizontal axis??
So it seems you might be as confused as me as to what the screen shots are showing / proving to us?
 Paul
PaulParticipant
Master
it’s informational and as Francesco pointed out. In it’s basics it’s obvious, but with numbers it’s more interesting.
And I should let it go, but one more, now with the cursor on the first bar and as comparison counting the number of hours too.
Sometimes, even when at or very close to the first bar, you get still a number which is below deducted from the total on the right.
you get this, the nettohour/bars are most important.
timeframe
total hours
total bars
end (right)
begin (left)
netto hours
end (right)
begin (left)
netto bars
hours*bars
1s
73
0
73
200.499
565
199.934
14.595.182
2s
142
12
130
219.939
20.065
199.874
25.983.620
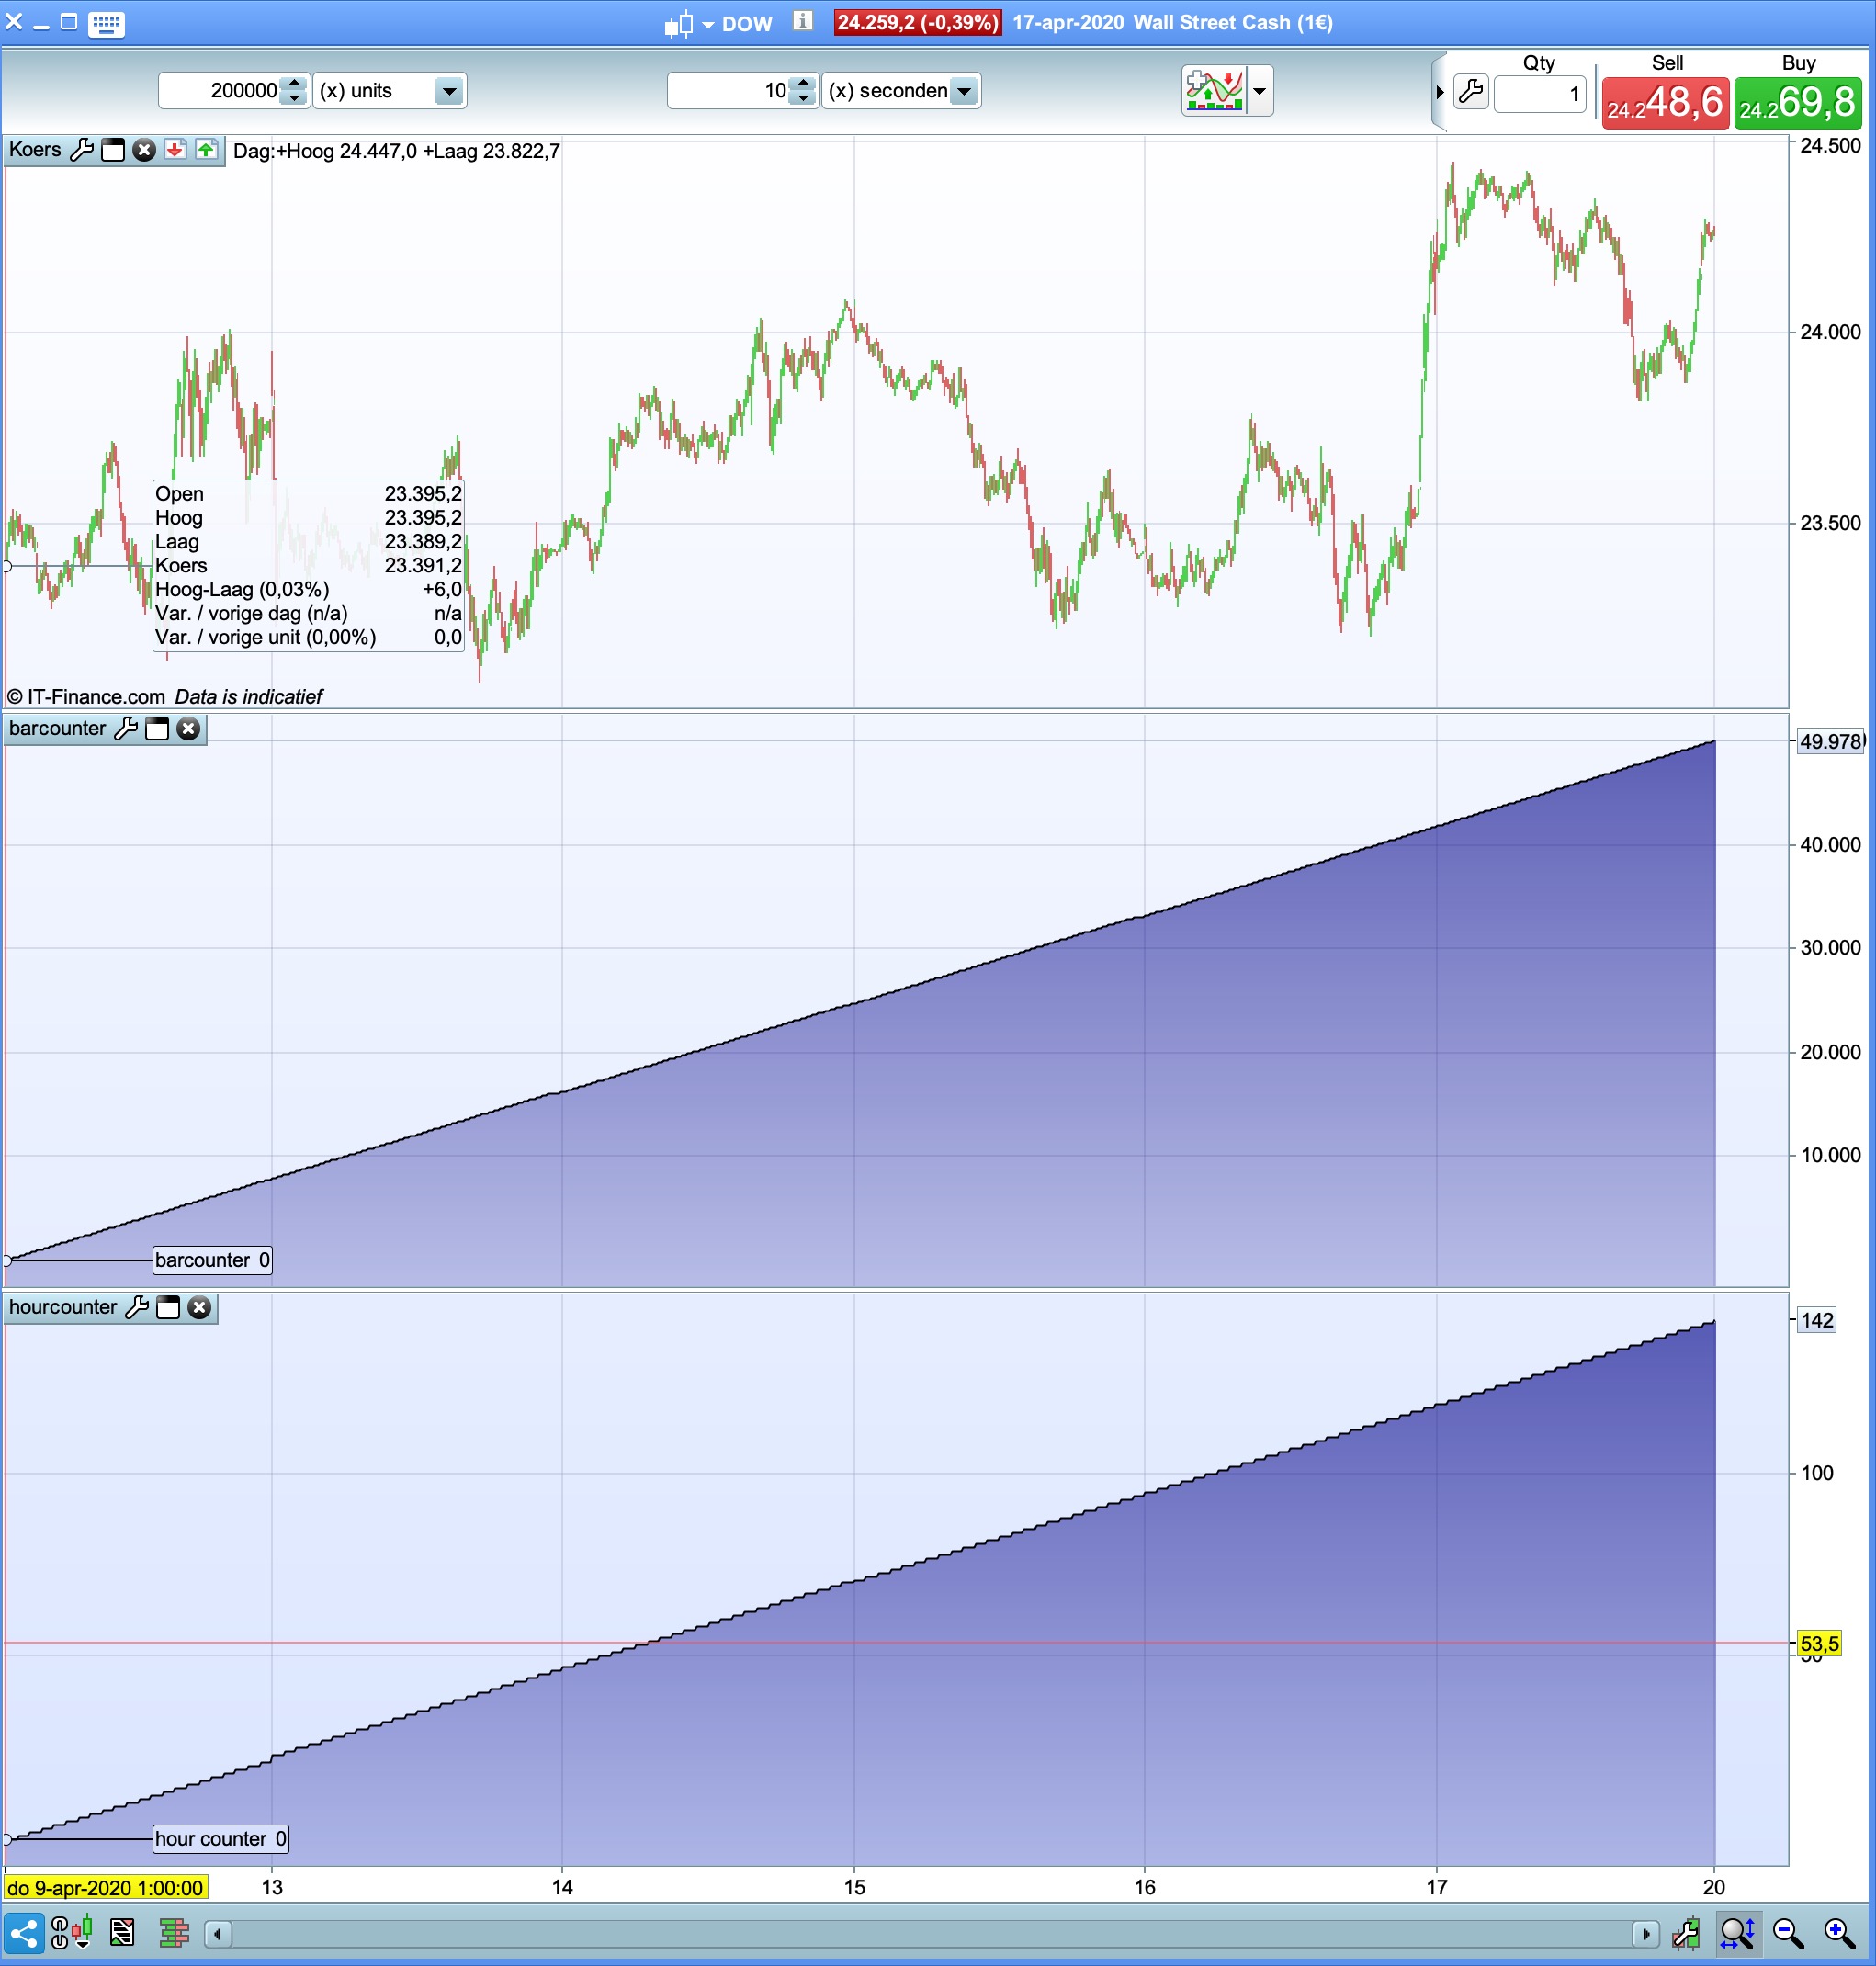
10s
142
0
142
49.978
0
49.978
7.096.876
in the indicators I used
return barindex
and for hours
if hour<>hour[1] then
hc=hc+1
endif

return hc as "hour counter"
it doesn’t prove anything but questions, is the 2s timeframe the best tf because of the (close to) highest number of bars & (close to) most number of hours to build a strategy on (in a timeframe below 1 min)? I find it hard to get good results on this btw.
 Bard
BardParticipant
Master
What is Wend? Particularly if there is a separate While statement in English.
Also how is this:
once renkoMax = ROUND(close / boxSize) * boxSize
defining a maximum? Dow 24,000/110 = 218 * 110 = 24,000. It’s a circular argument? Although I can understand how renkomin is defined.
For me Wend makes a big difference to profits if removed (and the cleaner version by Paul is used).
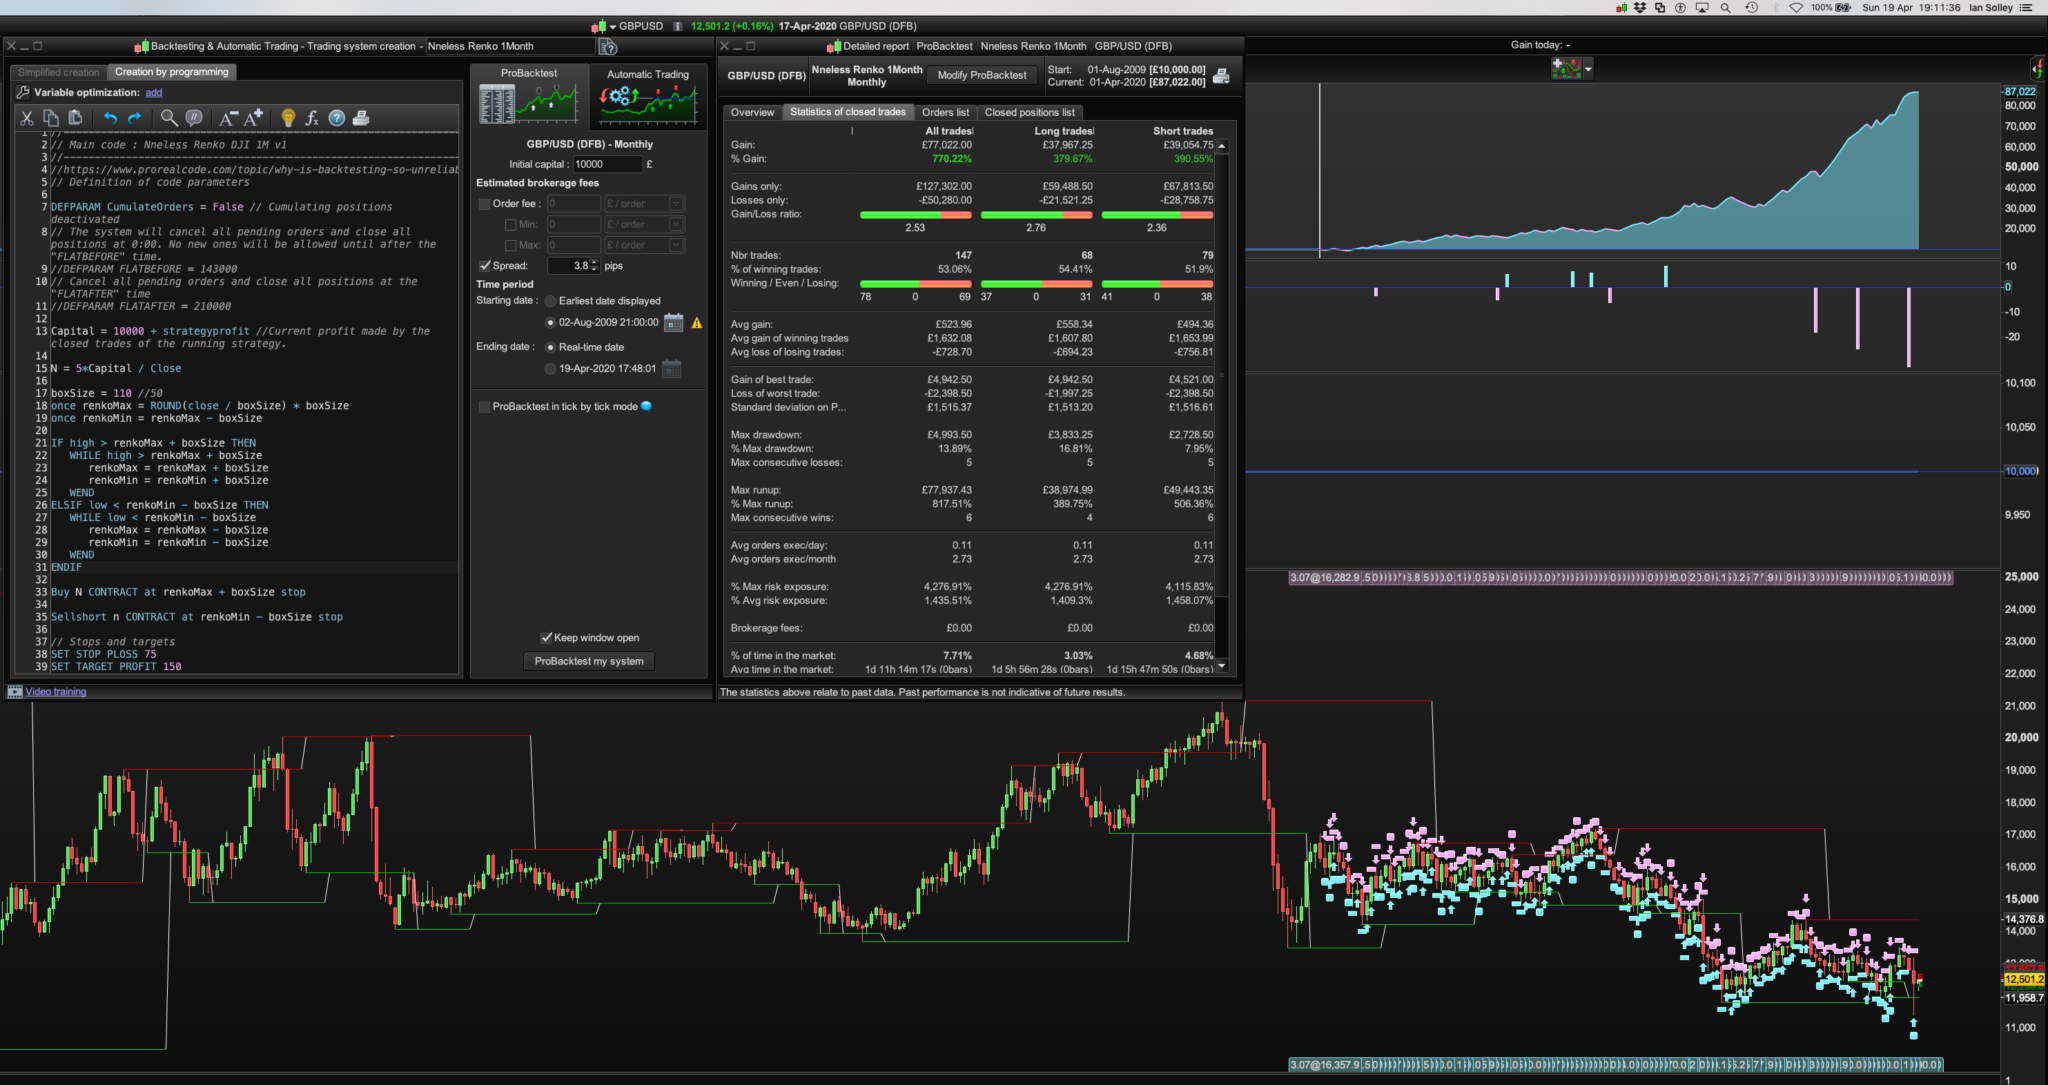
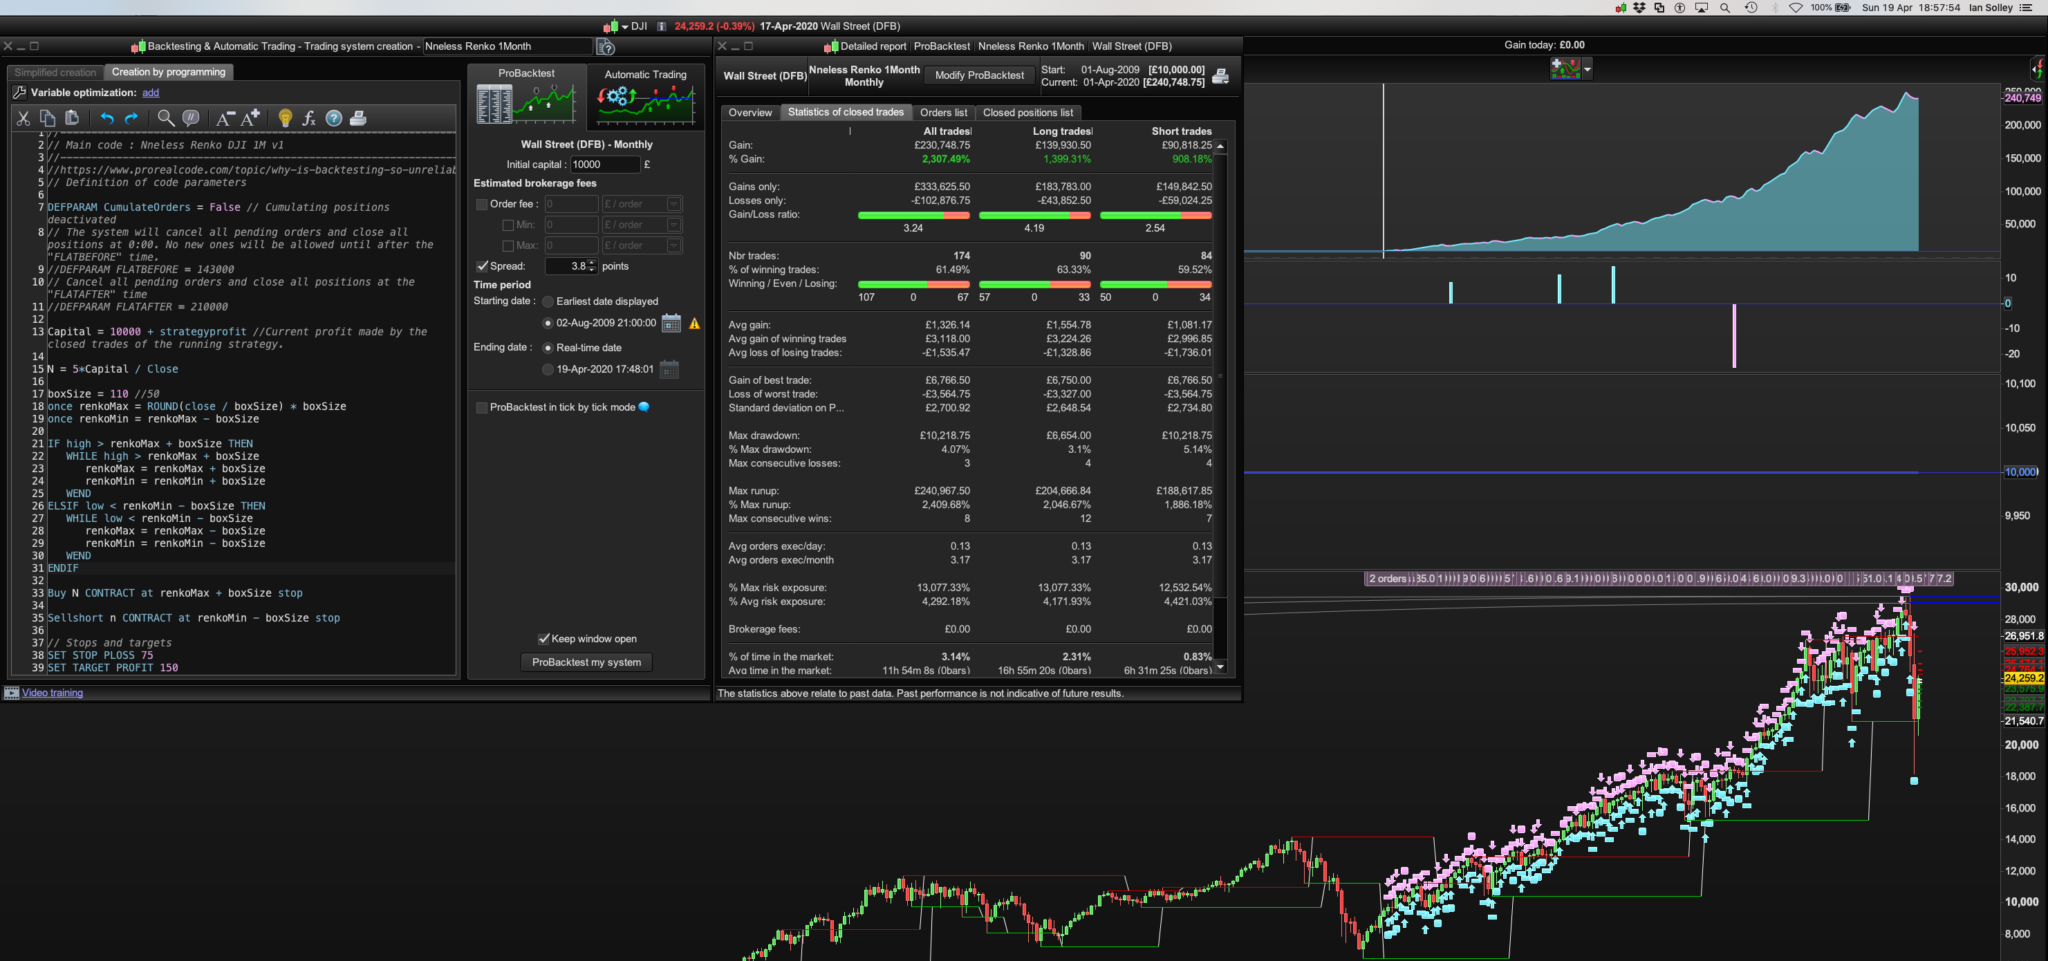
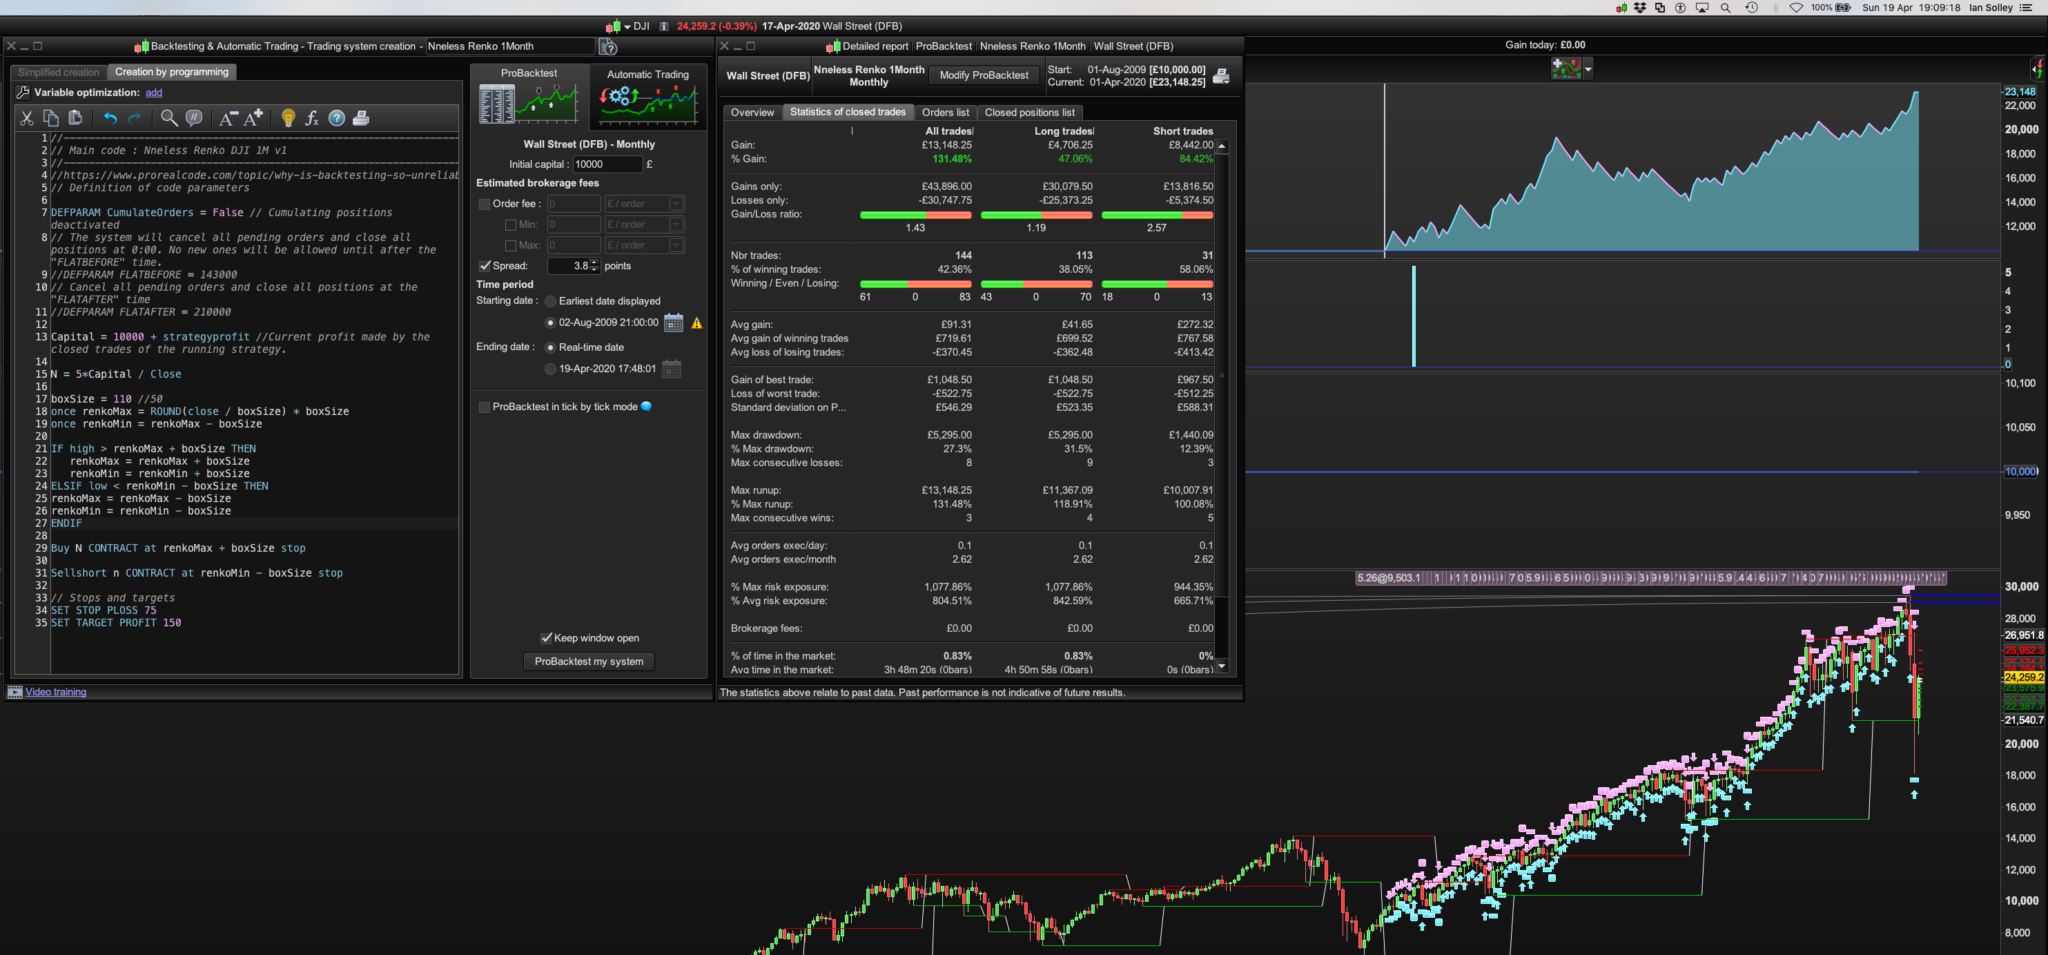
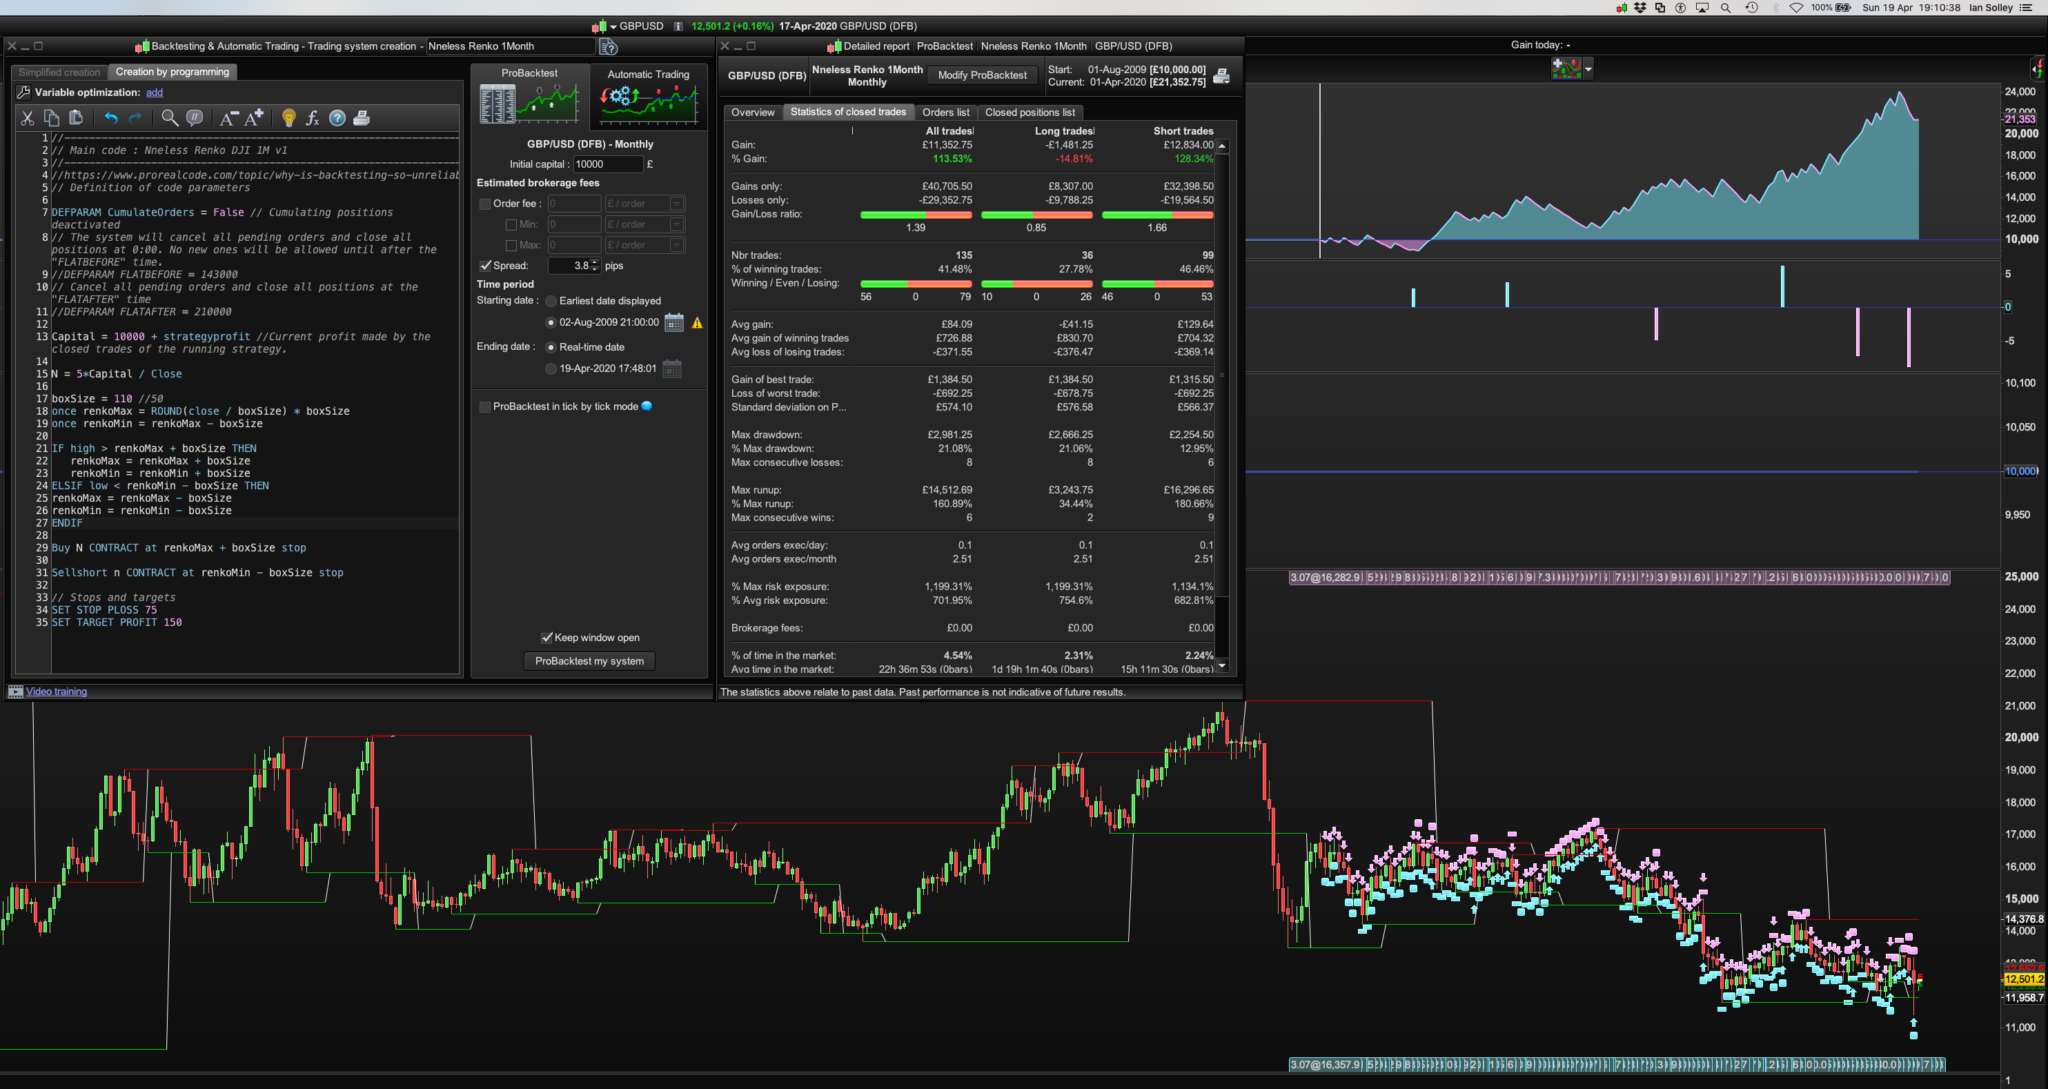
I assumed 1M meant minute but it performed poorly so I stuck it on the 1 Month Dow with very impressive results: Pls see monthly images of with and without “Wend” for my two favourites the Dow and the £/$, with large 3.8 spread for realistic market conditions:
What’s so special about 110? Ha ha.
You know what this means don’t you @GraHal? Lol, —–>> https://www.prorealcode.com/topic/machine-learning-in-proorder/page/3/#post-121130
My next post will show 1 x Machine Learning algo code applied to this strategy either here or at the topic url shown above. It beats the original non ML version, just. But if the £/tick multiplication of strategyprofit is doubled, drawdown remains low at 11% whilst profits go from £85k to £609k (2009-2020), although clearly ML settings were changed to attain these figures and therefore that experimentation is optimisation.
I’ve only been getting into watching Renko on charts for the last month, so thanks very much to @Nonetheless, @DocTrading, @GraHal and @Paul.
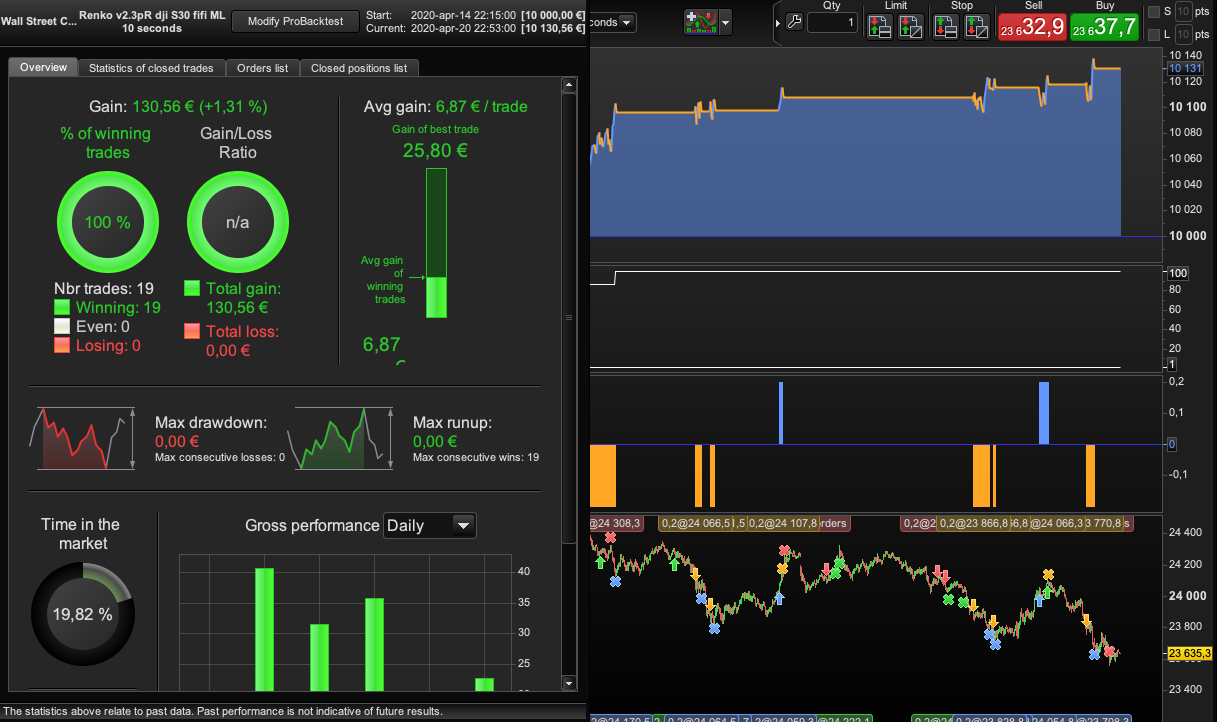
@Bard I reckon it’s loads easier for us to see at a glance System performance stats when the Overview Screen is posted.
It kind of jumps out the screen at me on the overview screen whereas on the Stats of Closed Trades screen (which you post) I have to zoom in and lean forward to my screen even then it’s a struggle.
Just a few thoughts anyway as I need to get into coffee like you!! 🙂
100% today with ML-kod Valuey set for box size 90, Valuex for renkotyp. 0.2 contract.
is it possible that you send the ITF code of this post? thank you in advance
your work is huge on the renko.. i always thought it was utopian to do a strategy on this but with dynamic boxsize trough machine learning, it can make sense
Congrats for that !
I have tested Bards excellent code both live and demo, exact same algo, that started on the exact same time. The stop don’t act the same. In live the stop is really trailing, and i can see it trailing in the chart. But not in demo it seems to allow it to draw back further when in gain, max loss is still the trailing stop value. Avg loosing trade is the trailing stop value (within a few bucks) after 40 trades (46% winning) and in live the avg loss is about half the trailing stop value.
In demo the trade stops out in loss or reverse position in gain and then stops out with trailing value loss. Have much better gain in demo then in live on same bot after 6 hours. Maybe i will start another bot with fixed stop to compare the outcome?
Im €400 in gain in demo (1 contract) and about €100 in gain in live with exactly the same bot from the same time. I think that it makes the winners run further in demo because of the stop issue. The max winning in demo is 190 and in live 55.
What setting for spread did you use for Demo Forward Test?
Also what instrument and what Timeframe did you test on?
in demo it seems to allow it to draw back further
Are you saying that the Trailing Stop moves further away from Price (the opposite of what is should do).
Hi GraHal,
I don’t see the trailing stop “trail” in the same way like in live.
I have spread of 4 in demo. DOW 5min TF.
The trailing stop was at value of 20 and the profit went from €165+ to just under €100 and then back up. In Live the stop was taken (also value of 20) 1 contract on each algo.
BardParticipant
Master
Good point GraHal, I just wish PRT would put the % drawdown on the Overview page and not just the max DD. That is my number one priority. I don’t care how much a system makes if I can’t live with the % amount of drawdown!