boxsize would have changed from the startingvalue 27 after 8 trades
possibly true, i’d have to graph it. But assuming it did change, it changed for the worse, as I take a loss on the 24th where you get a gain. Lengthy forward testing is the only way with such short TFs. Even with 200k, the back test only says whether or not it worked last week … not much to go on.
Yes I agree, this is a massive disadvantage on this timeframe. I wonder why the ML changes for the worse though, what can be changed for it to make a better decision? I was hoping fixed all and pt would help but that might not be the case.
In my previous post I was meant to say fixed “sl and pt” – autocorrect..
I wonder why the ML changes for the worse though
Different price conditions on 23/4.
If from one day to the next price changes from big swings / trends up to little swings / trends up (and opposite for shorts) then the box size which was valid on 23/4 (for big swings) will not be valid on 24/4 (for little swings) … so the ML would need a lot of trades on 24/4 to adjust the value back to a good / winning value.
I was manual trading on 5 sec TF on 24/4 and it was a waste of my time because price was up a few points down a few points, up a few points, down a few points .. all day long it seemed?
Just a few thoughts anyway … I still think daily optimisation is the way to go on sub 1 min TF’s … even with the ML also doing additional optimisation on the fly within the strategy.
 Paul
PaulParticipant
Master
wonder why the ML changes for the worse though
What GraHal said and the way the code was setup, means there are a lot of signals which are ignored when in a position. The backtest results are basically luck. Maybe ML has more chance, when it realise a position is opened and going in the opposite direction and a new signal appears in the same directions, the previous one is closed an a new one is opened with new parameters.
So i.e. a long position in loss is closed and taken in consideration with ML because the long signal appears in the same direction. It gives meaning to a bad signal, which can maybe influence the next one for the better. When a trade long is positive and another long signal appears then there’s no action. Only in loss. Or you could do the opposite 🙂
I believe and very well could be wrong here, but if the backtest results don’t change too much with more trades, the strategy is more robust. However still it’s no guarantee. I don’t think ML is the holy grail in this btw.
Is anyone testing in demo 2.3pr? Which timeframe, boxsize, renkotype and stoploss?
Can i have result images? Thanks.
Anyone still running 10s/1s?
 Bard
BardParticipant
Master
Anyone still running 10s/1s?
Can anyone explain how you can make a profit on such a small TF when the spread is taken into account and how long are the trades held onto? I know when I was live scalping Forex that I couldn’t make money on anything under a 3 minute chart.
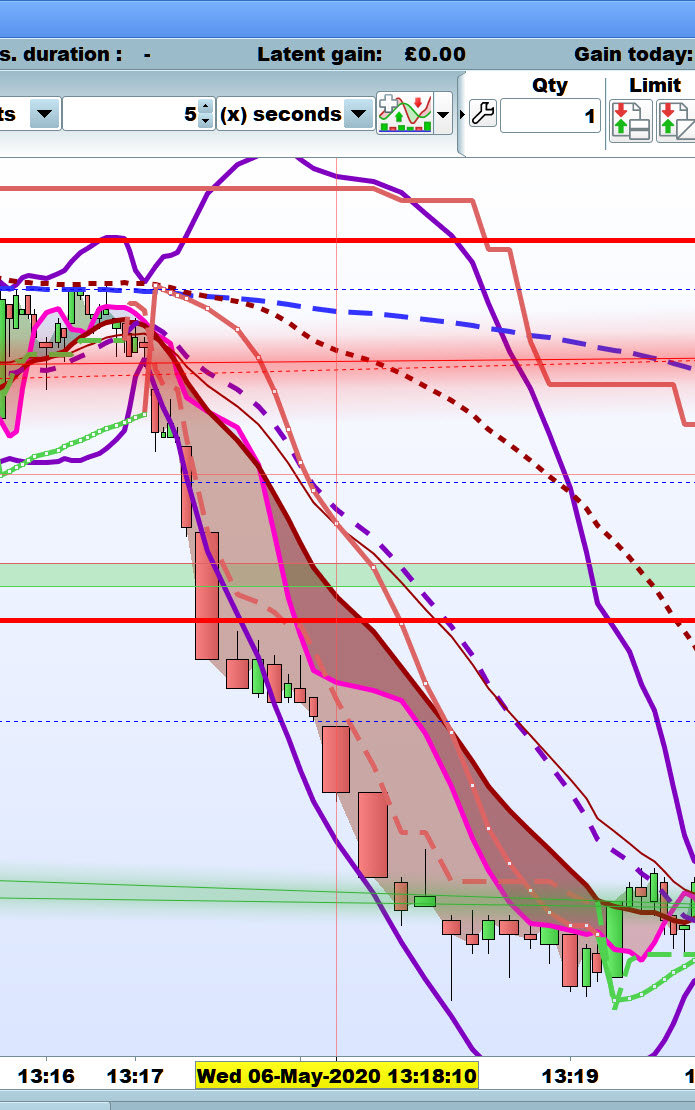
How about coding for conditions as attached … happened at 13:17 today and was all over 2 minutes later!
Generally happens several times per day … Open – Close > x and exit at first pull back > Y etc?
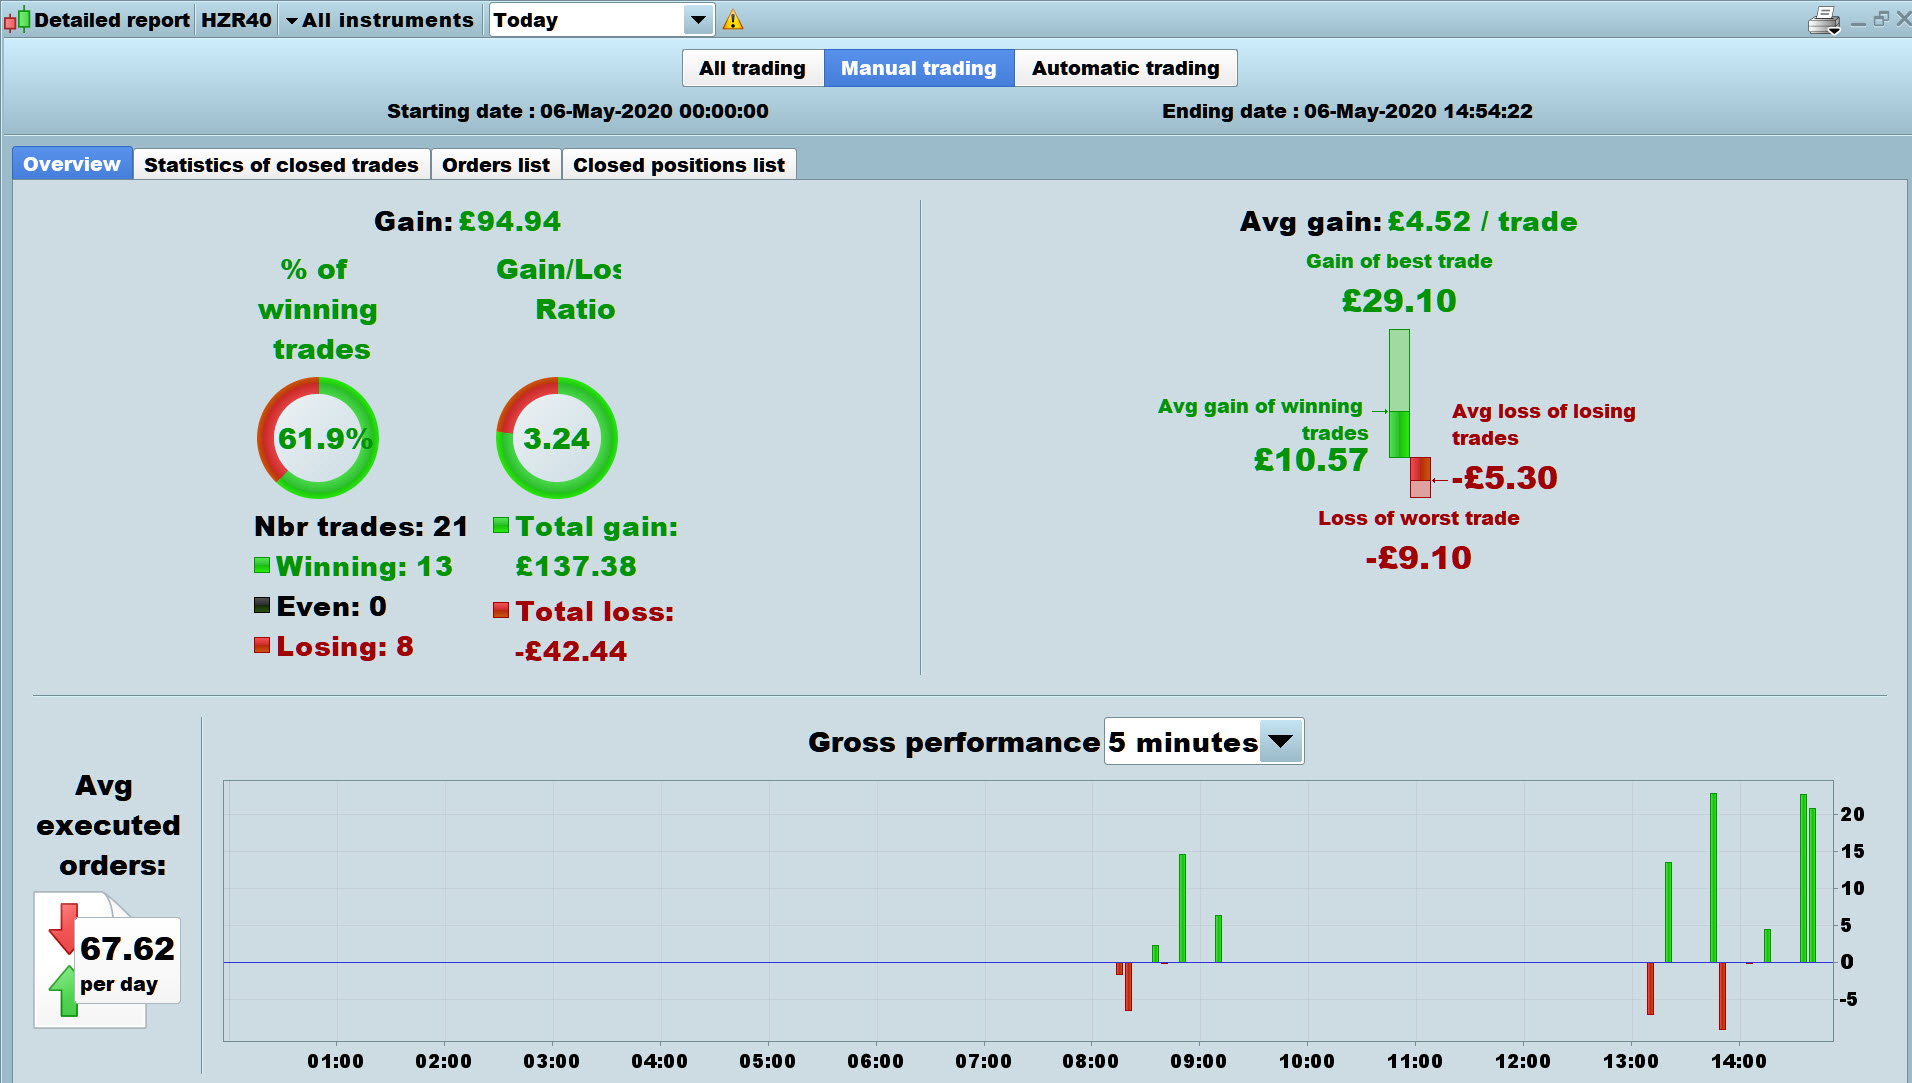
I’ve made £95 today on 6 trades like attached and lots of little ones.
I was mad again as yesterday 3 x Algos on 5 Min TF lost me £80 so I made it back up on manual trades! Maybe I should get mad more often!? 🙂
I think we need to look at a scenarios as attached and code for it … then backtest to see if it works / optimise ??
Maybe it won’t work and only the human eye / brain can take it all in!? 🙂
PS
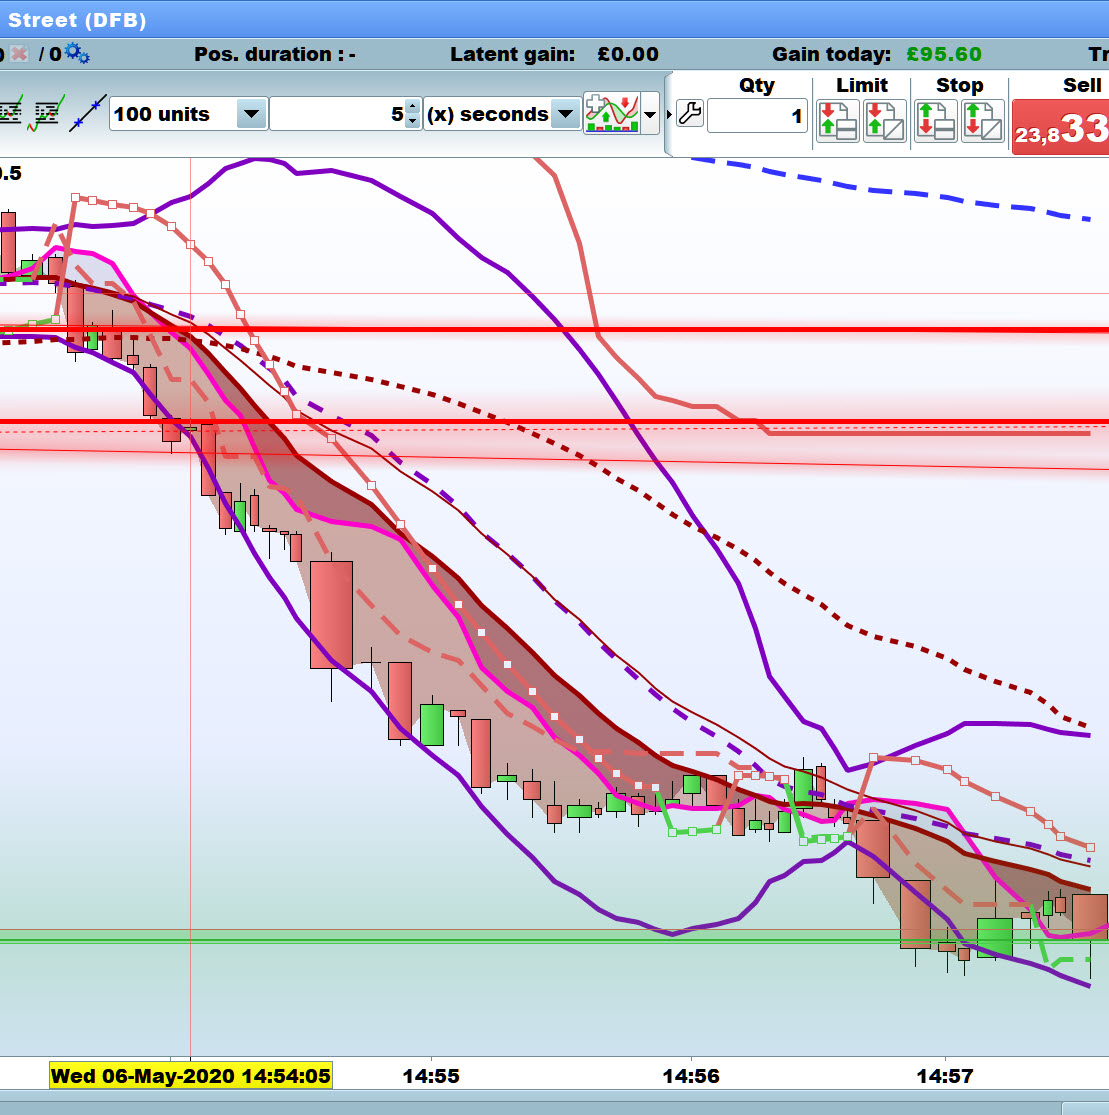
Dam … just missed another while typing this! See Renko 2 attached!
I can’t understand exactly what conditions you are referring to, that chart is a labyrinth 😮
Chart is on a 5 sec TF and I am referring to the several successive red candles that provide a very short term profitable run.
I know you were joking … right!? 🙂
So you mean doing something like that? Long when body and the low of the last candle is greater then previous 2 candle and viceversa
In certain hour times also? Maybe adding a bearish/bullish detection?
body= abs(close - open)
short= open>close
long= close>open

if close>close[1] then
   if body>body[1] and body>body[2] then
      if short[1] then
         sellshort 1 contract at market
      endif
   endif
elsif close<close[1] then
   if body>body[1] and body>body[2] then
      if long[1] then
         buy 1 contract at market
      endif
   endif
endif
Not Tested
Yeah might work, but also maybe needs a size of body in the code as these ‘explosions’ happen with bigger candles than most candles … I guess it’s caused by an institution selling / buying a lot of stock?
Also as soon as there is a pullback > y points then exit?
All needs to be optimised and backtested etc, but I was just trying to show by my results today that it can work.
I use the 5 sec TF because – if short – then it’s easy to see green candles forming and their size re a pullback etc.
I didn’t know you were that quick at coding … I’ll go check out your latest Scalpmaster! 🙂
Just found that snippet in the forum, i’m not that good 🙂
I have been running the renko v2p dji 1sec_mod fifi and it is running very well but its stopping sometimes and I dont know why.. I have capital free so i cant tell why its doing that.