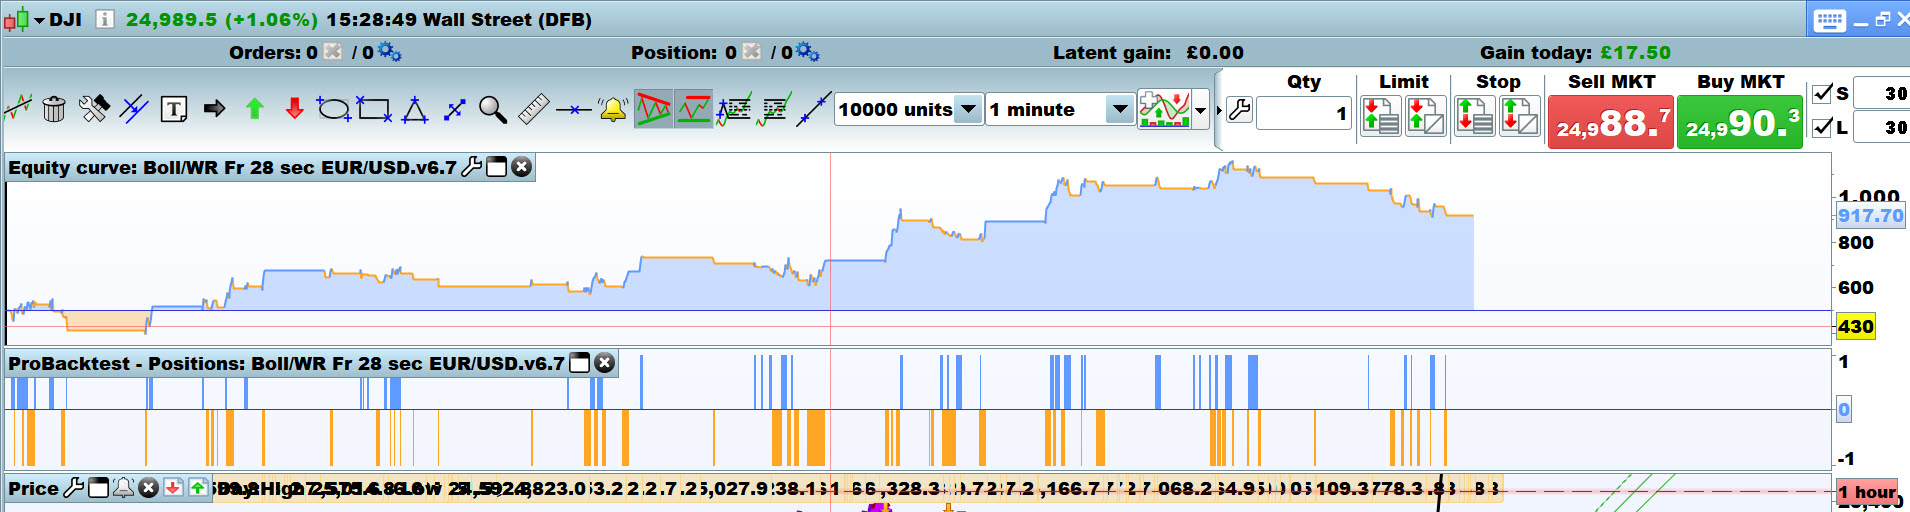
On a brighter note, Gertrade 28 sec v 6.7 Algo is doing well over 10,000 bars @ 1 Min TF on the Dow!!!! 🙂
Well Done G
GraHal
Bravo Grahal,
It’s very interesting as information, I’ll look at it closely. In addition, with a TF 1mn we will have 200,000 units of history.
I’ve set v 6.7 going Live on Dow spreadbet @ £1 per point, so don’t worry and as soon as it triggers I’ll be watching the trade develop on the screen! 🙂
I’ll let you know how it goes!
Come on Vonasi stop sipping that wine and soaking up the Greek sun on your boat … what you reckon??
Actually today I was installing a new electric toilet pump so spent the day in a very small room removing all the toilet pipes and then refitting them – ghastly job! The sun was out but I didn’t see any of it. That is the glamorous life of a sailor for you. It is not a G and T’s on the poop deck! I’ll try to give trading some more time soon…..
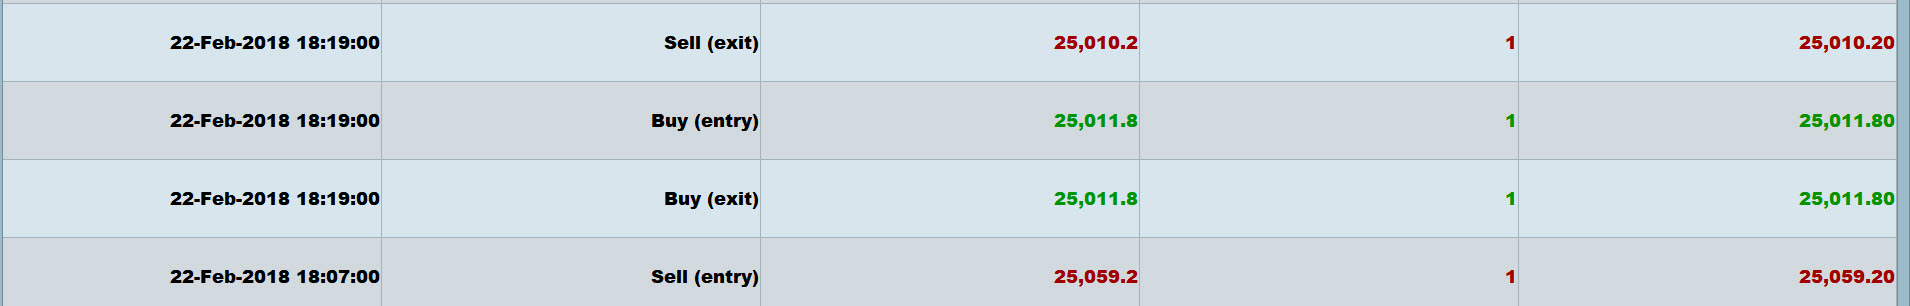
Two profitable trades already on the Dow with v6.7!
Both trades were in profit within seconds with very little pullback straight on towards the Take Profit. But a strange thing happened … the Nicolas trailing stop was reassuringly moving forward 2 points each bar but was still > 20 points behind price. Price did not retrace then all of sudden, bang the short trade exited followed immediately by a Long which then immediately exited also.
Is this in the code Gertrade … to enter the opposite direction and then exit if not immediately in profit? I’m not complaining like … it was all very exciting!!! 🙂
Attached is the trade I describe above. I manually exited the 2nd trade as the momentum was slowing at about 2/3 of the way to the take profit Limit … still a good profit though!
Thank You
GraHal
Good Grahal! all this is very interesting.
The output of the trade seems normal, probably caused by an output signal.
I will provide you with a visual indicator that helps me understand the inputs and outputs. there are four arrow colors:
– green: purchase
– red: sale
– cyan: purchase release
– purple: outlet sale
on the arrows there are figures that correspond to the modules executed in the strategy. The code of the indicator is identical to the strategy code except the dual-management managed by the equity curve.
figures 1 and 2 (sales and purchases) correspond to strategy 1: equity> average equities.
figures 3 and 4 (sales and purchases) correspond to strategy 1: equity <equity averages
the other figures are allocated to outputs whose execution does not depend on the dual strategy system.
Good trades!
ci-dessous votre indicateur visuel (attention!!! le nom est le même que la stratégie)
Wow yeah very clever Gertrade and very useful for a user of your code to easily see which condition / module has triggered the trade etc.
I’ve got it working (I increased font size for the numbers to 18) I will provide feedback during the course of me using it.
Thank You
GraHal
Hi everybody,
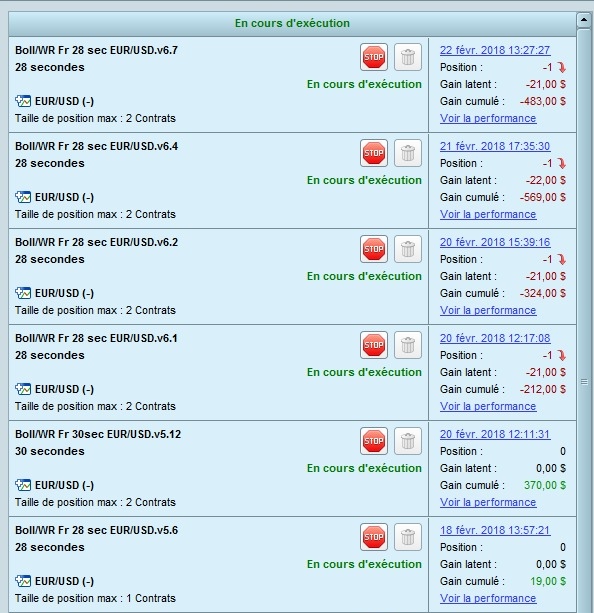
Here are some ProOrder live performances for the v5x and v6x @Gertrade algos. I have stopped all the v2x and v4x, because all of them had big losses, that got worse day after day.
After a good beginning, all the v6 versions sink now.
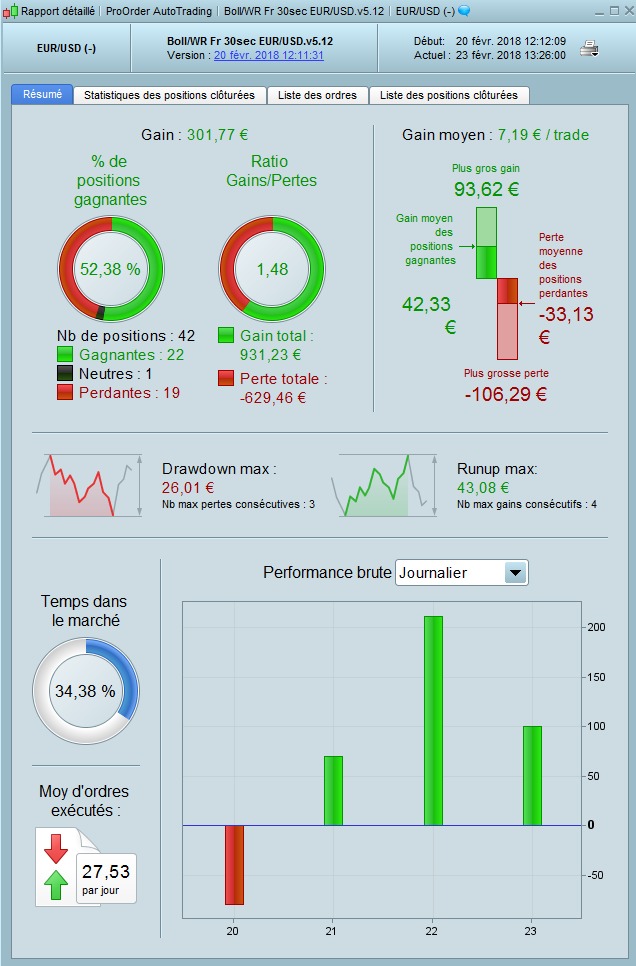
But the surprise is the v5.12, the only version that works with 30 sec TF ; as you can see, results are good, for 3 days out of 4. Maybe it will be interesting to look at it closely, and to concentrate on that 30 sec TF…
Thanks for all
Cyril
@ Grahal,
If you want to improve the yield and equity curve of the V6.7 on the Dow Jones, I advise you to create a strategy for the Dow Jones.
For that, you have to get started in optimizing variables. Each variable must be optimized independently of the others, one after the other. First, do those of momentum1 and momentum2. Then individually optimize the variables in rows 172 to 185. You will see a marked improvement in your return and the equity curve in Backtest. This work can be done on each Index, Currency or other medium.
I just performed this optimization work on the DAX and I give you below the V6.71 version adapted to the DAX (Germany30 € 1 / point).
cordially
Gertrade
Very important for the development and the understanding of the trades, the visual indicator adapted to DAX version V6.71 delivered below.
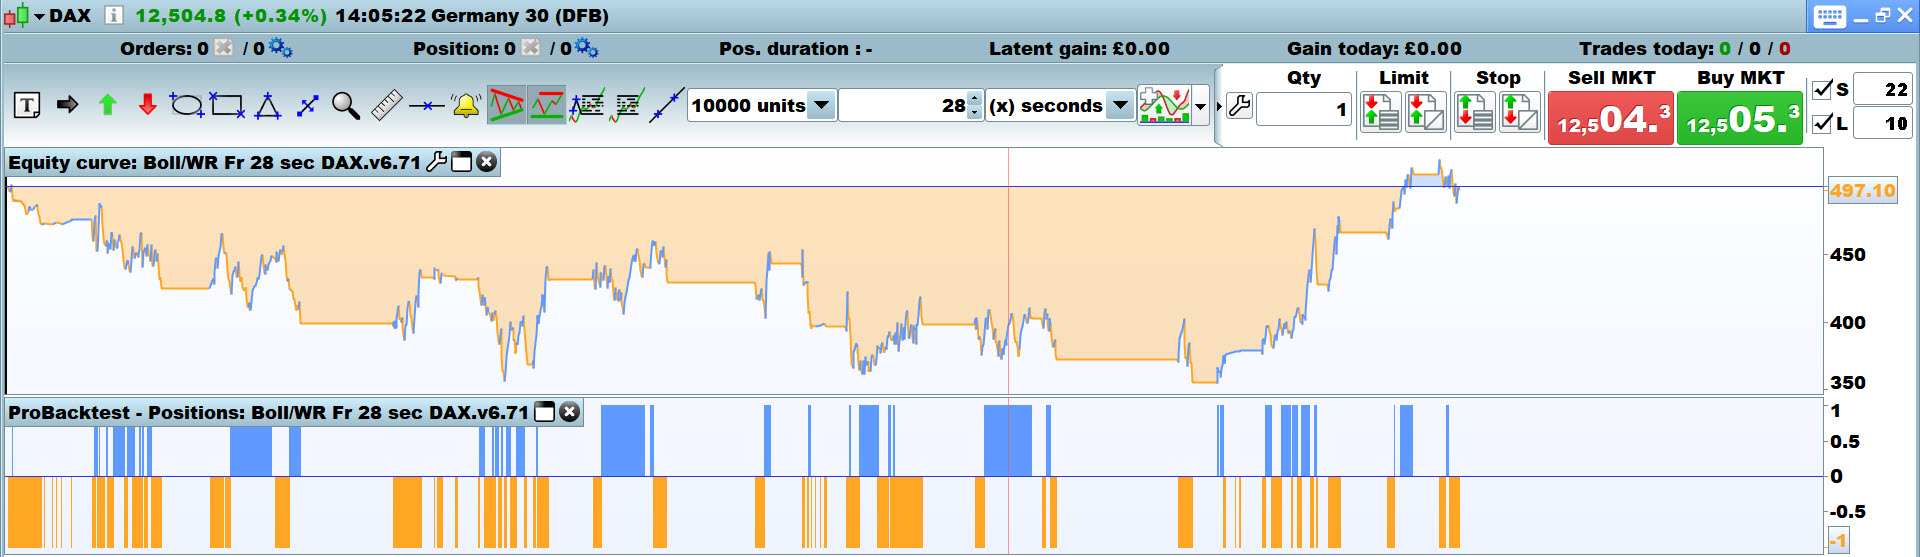
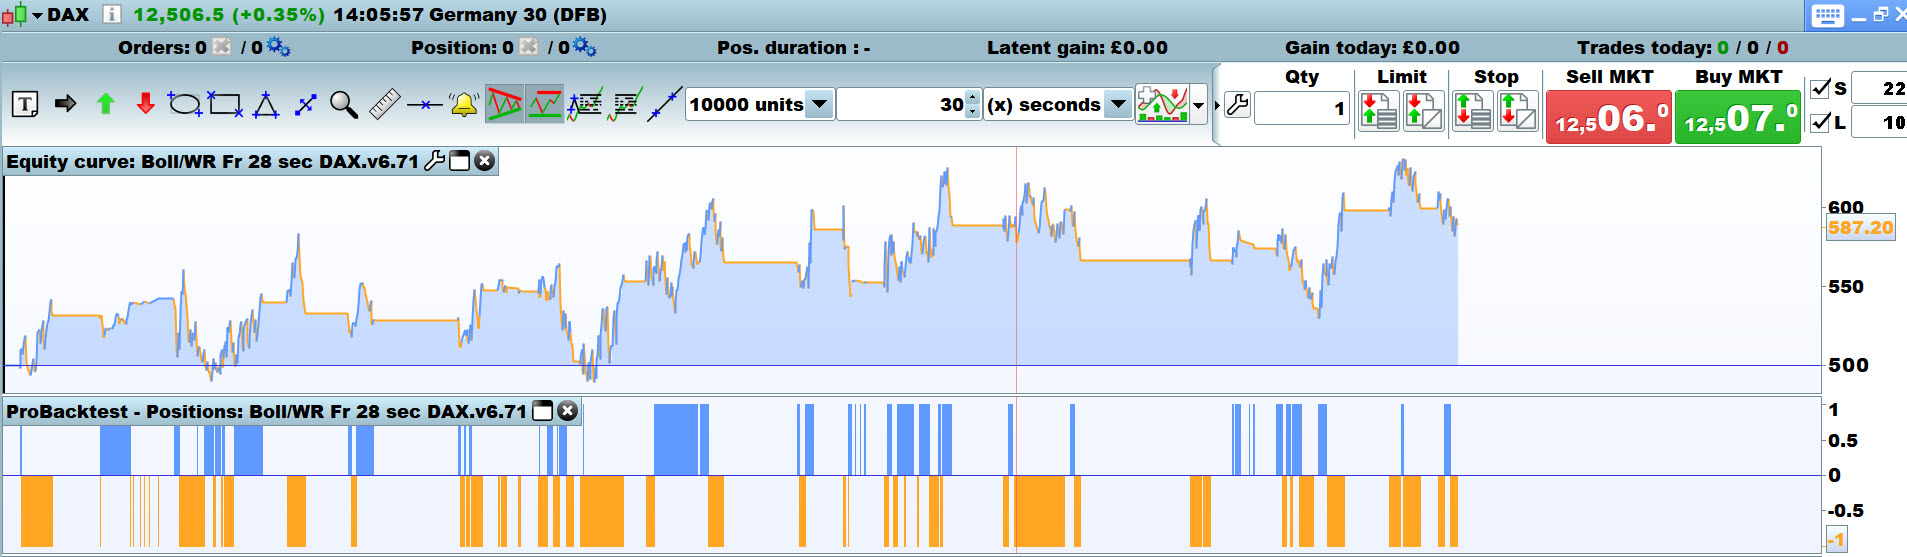
Well there’s a funny thing?? 🙂
1st image is the 28 sec DAX V6.71 on a 28 Sec TF
2nd image is the 28 sec DAX V6.71 on a 30 Sec TF
Please could you post the equity curve you got with the 28 sec DAX V6.71 on a 28 Sec TF Gertrade?
@ Cyril21,
The work you do on ProOrder is important, and I thank you for it, the V5.12 escaped me. For the V6.7, I see that you are in deficit, a pity that you did not start yesterday, you would still be profitable today (There is a bit of luck in the startup, so you have to be well capitalized in real trading to escape Drawdowns). I am now focusing my attention on this version V6.7 which is more successful at the level of the code and which integrates 2 systems in 1 (2 times more likely to be in the trend).
cordially
Gertrade
@ Grahal,
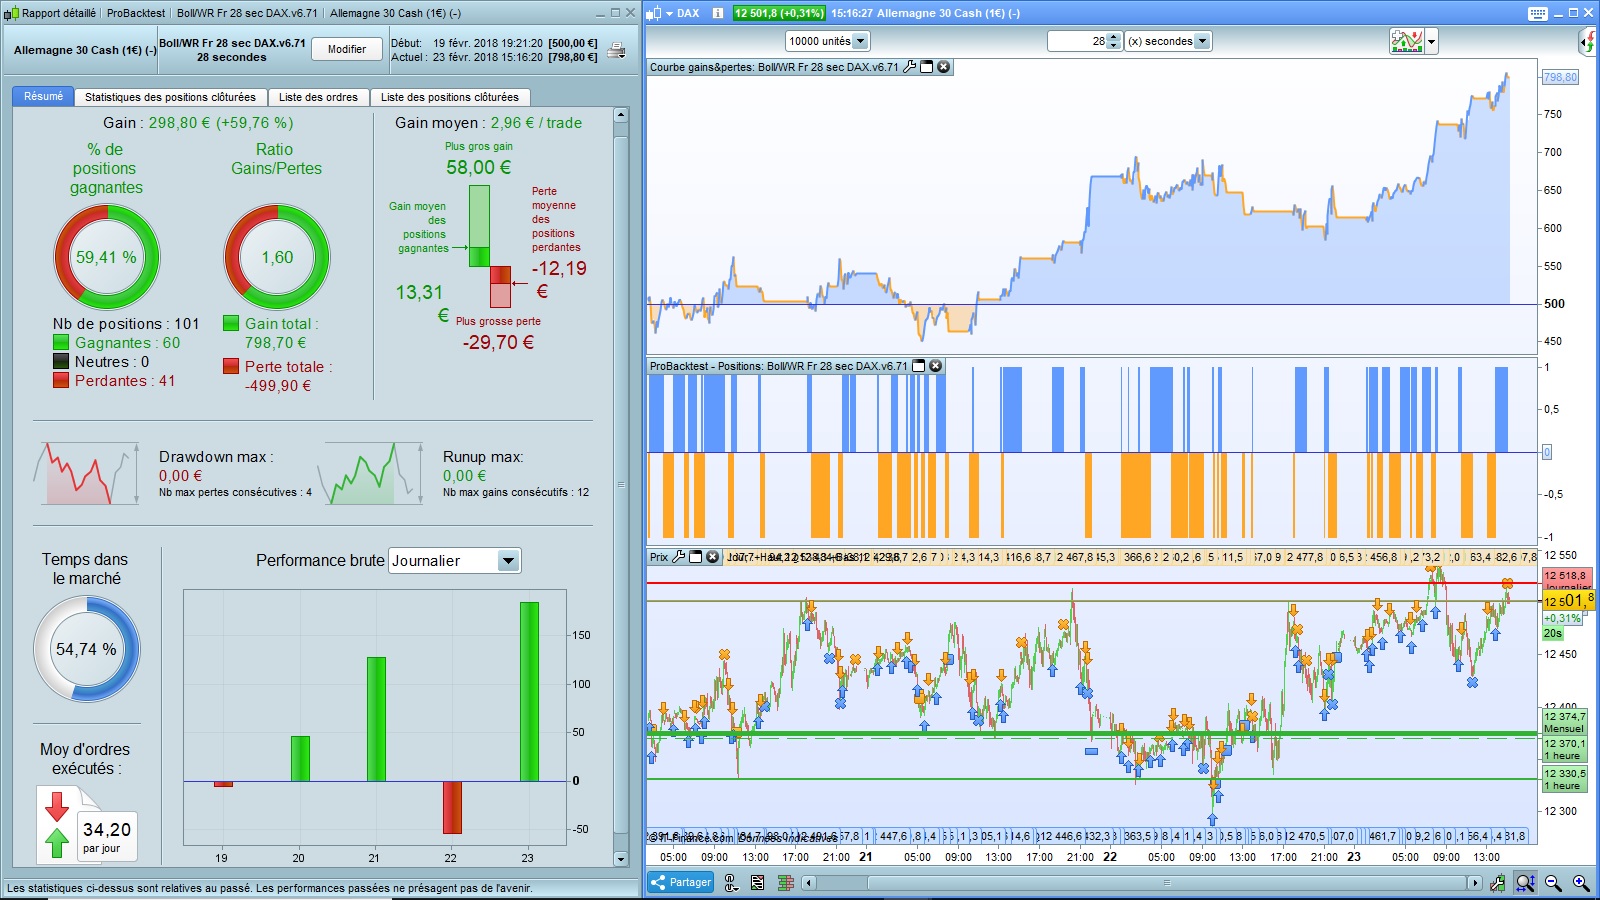
Below are the results and graphics of V6.71 on 10,000 units with a spread of 2.
@ Grahal,
Apparently, we do not use the same support, so we do not have the same history. You are on Germany30 (DFB) and me on Germany30 Cash.
That’s why it is important that you optimize your personal version on your Germany30 (DFB) index.
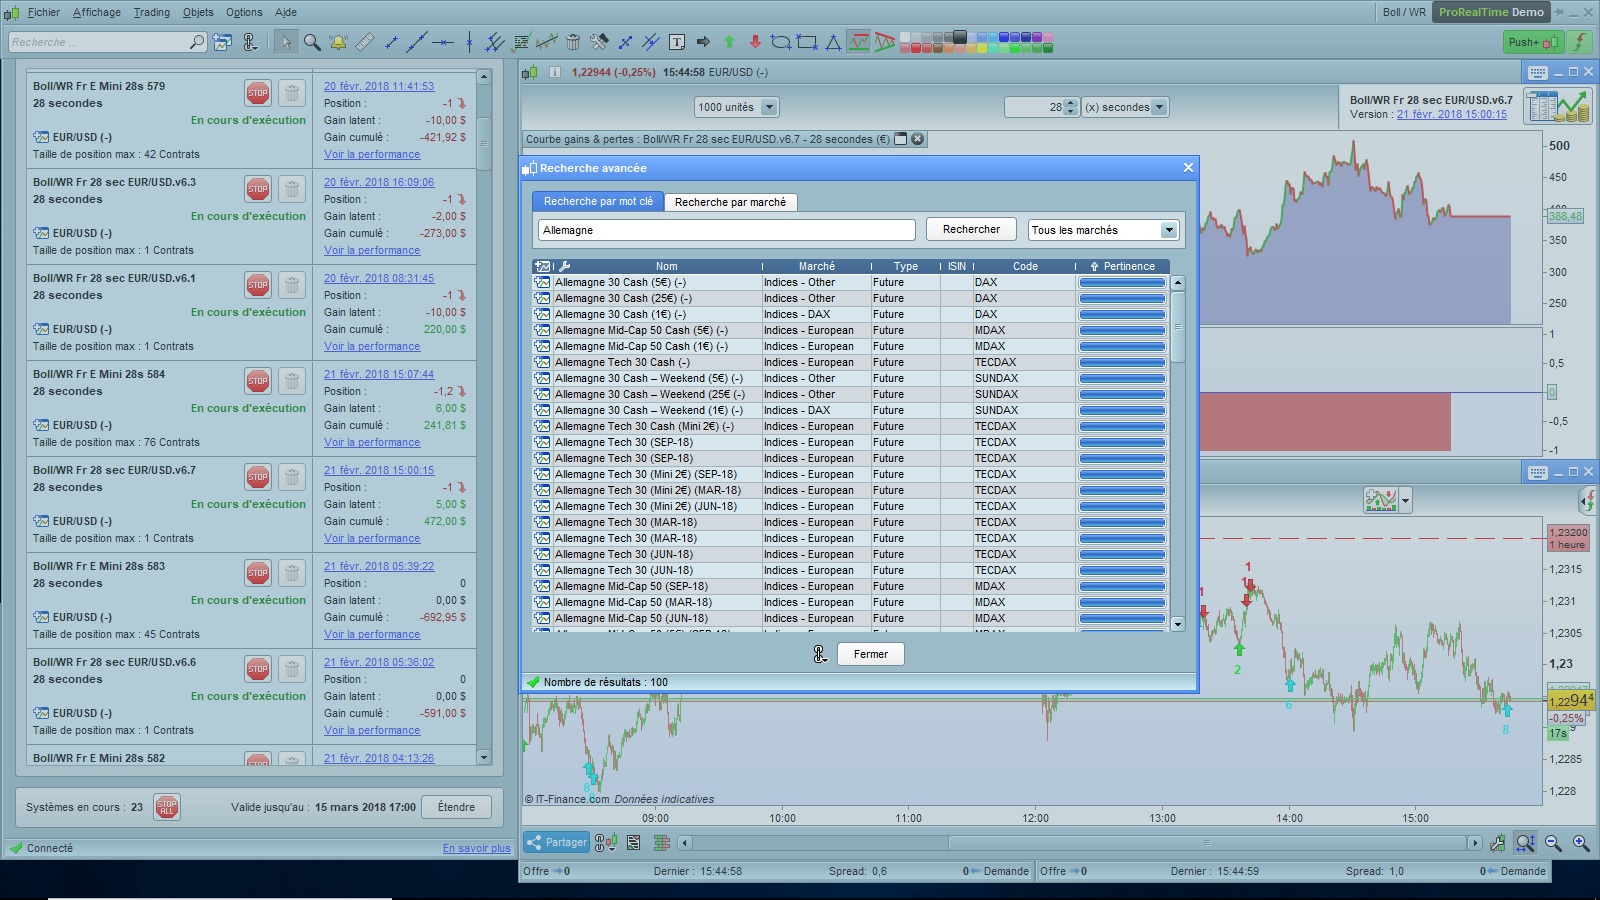
@ Grahal,
Here is the advanced search table for the DAX, I selected the 3rd line.