Hi, Wanted to come up with something that produces reasonable results.
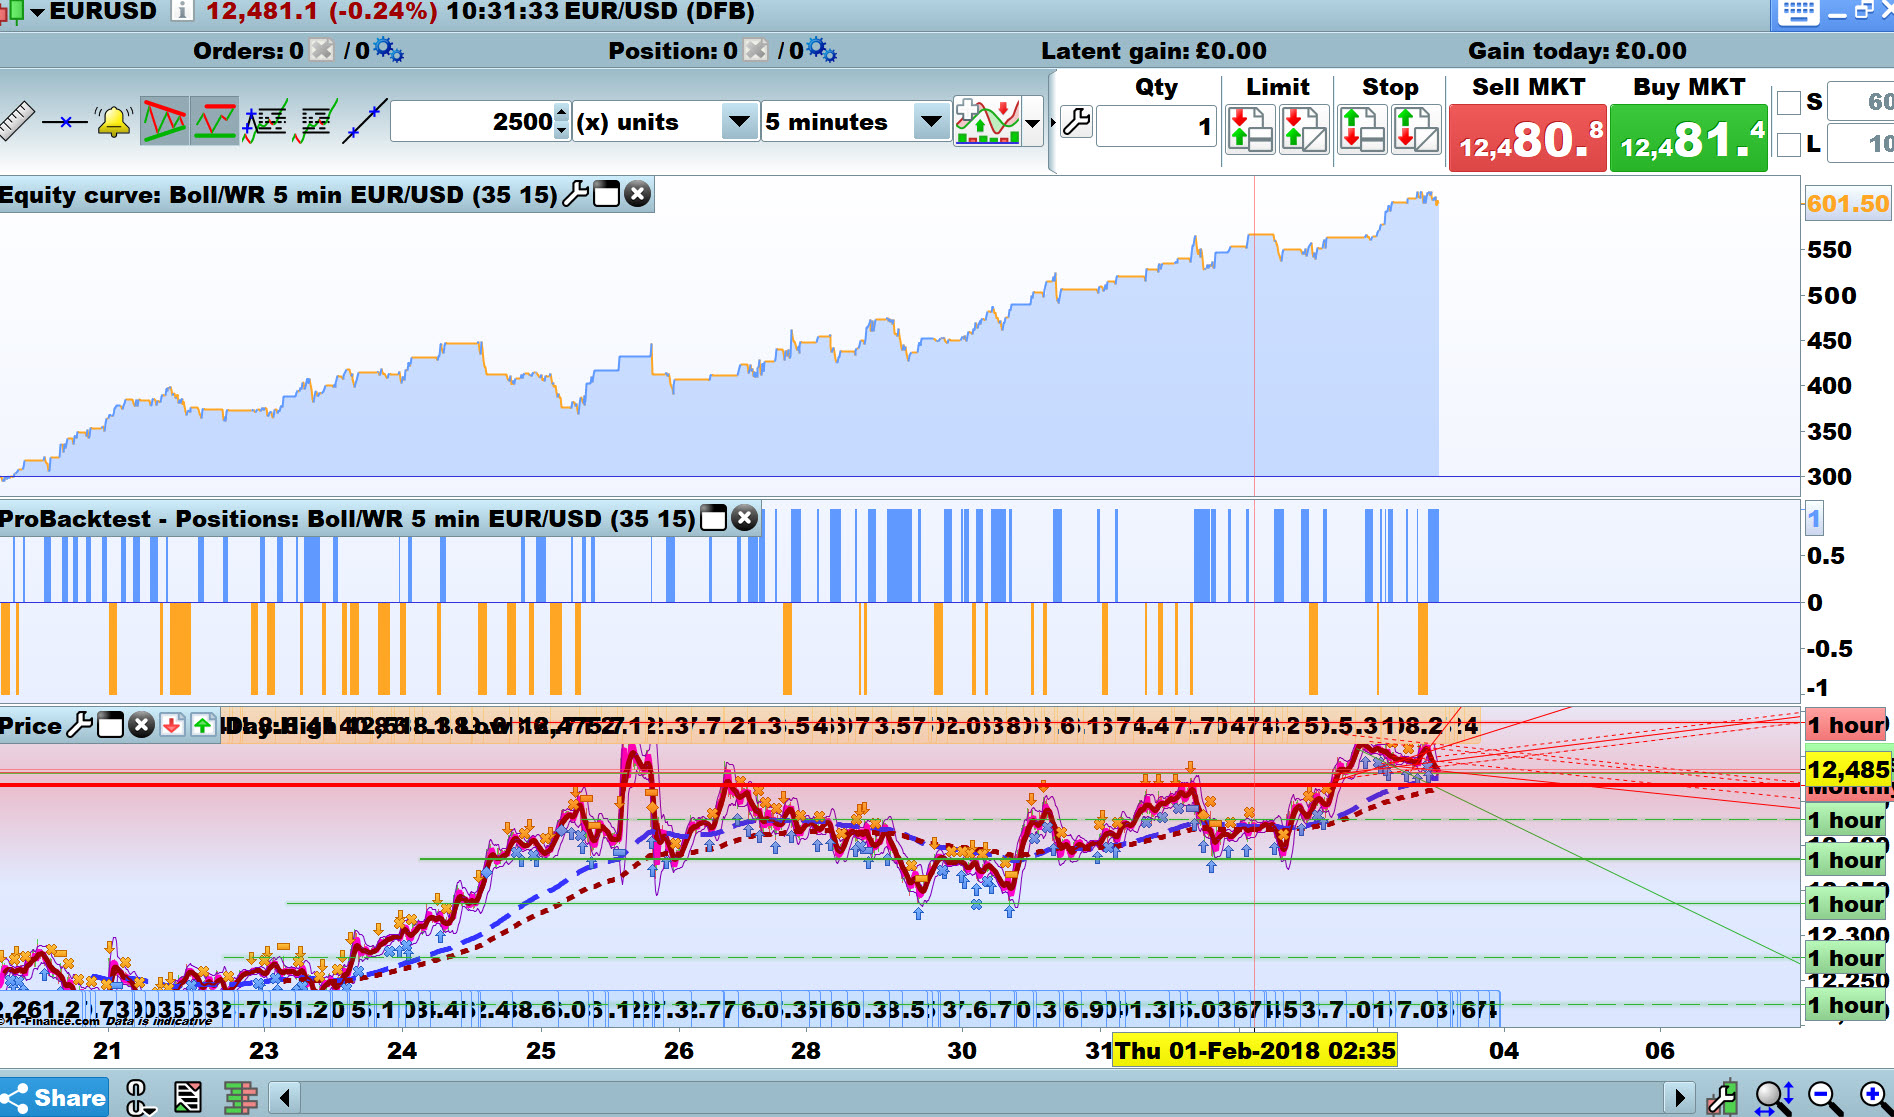
Works well in ranging markets but does lose a little when the markets shoots off in any one direction.
Would be good to refine it further, see what you think?
I am new to this so please dont ask me any questions on the coding as i wont be able to help.
Feel free to down load and improve on if you wish.
Cheerss
Hi Jusmih1
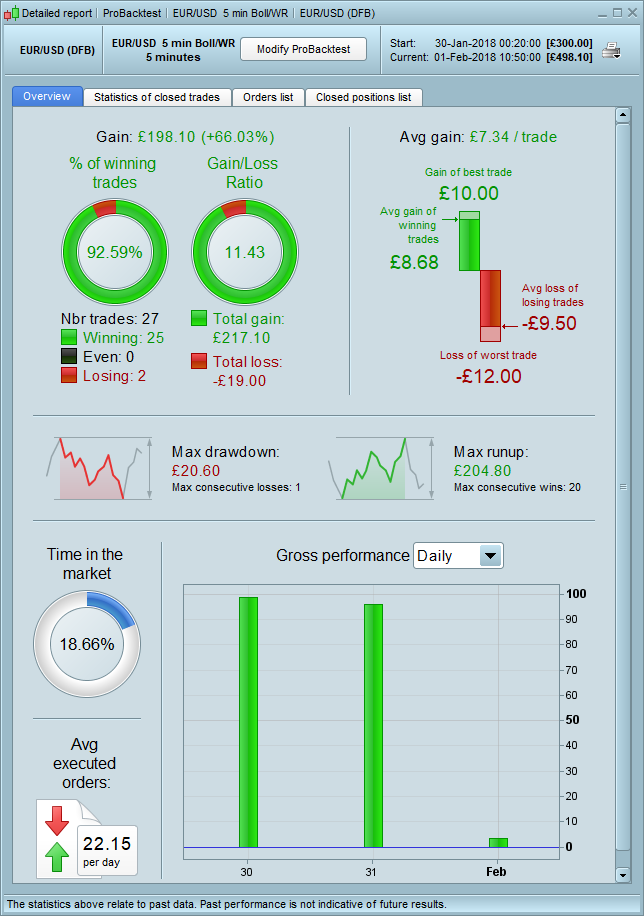
Looks promising! I changed just TS and TP to below and – with spread = 1 over 2,500 bars – results are attached.
SET STOP pTRAILING 35
SET TARGET pPROFIT 15
Cheers
GraHal
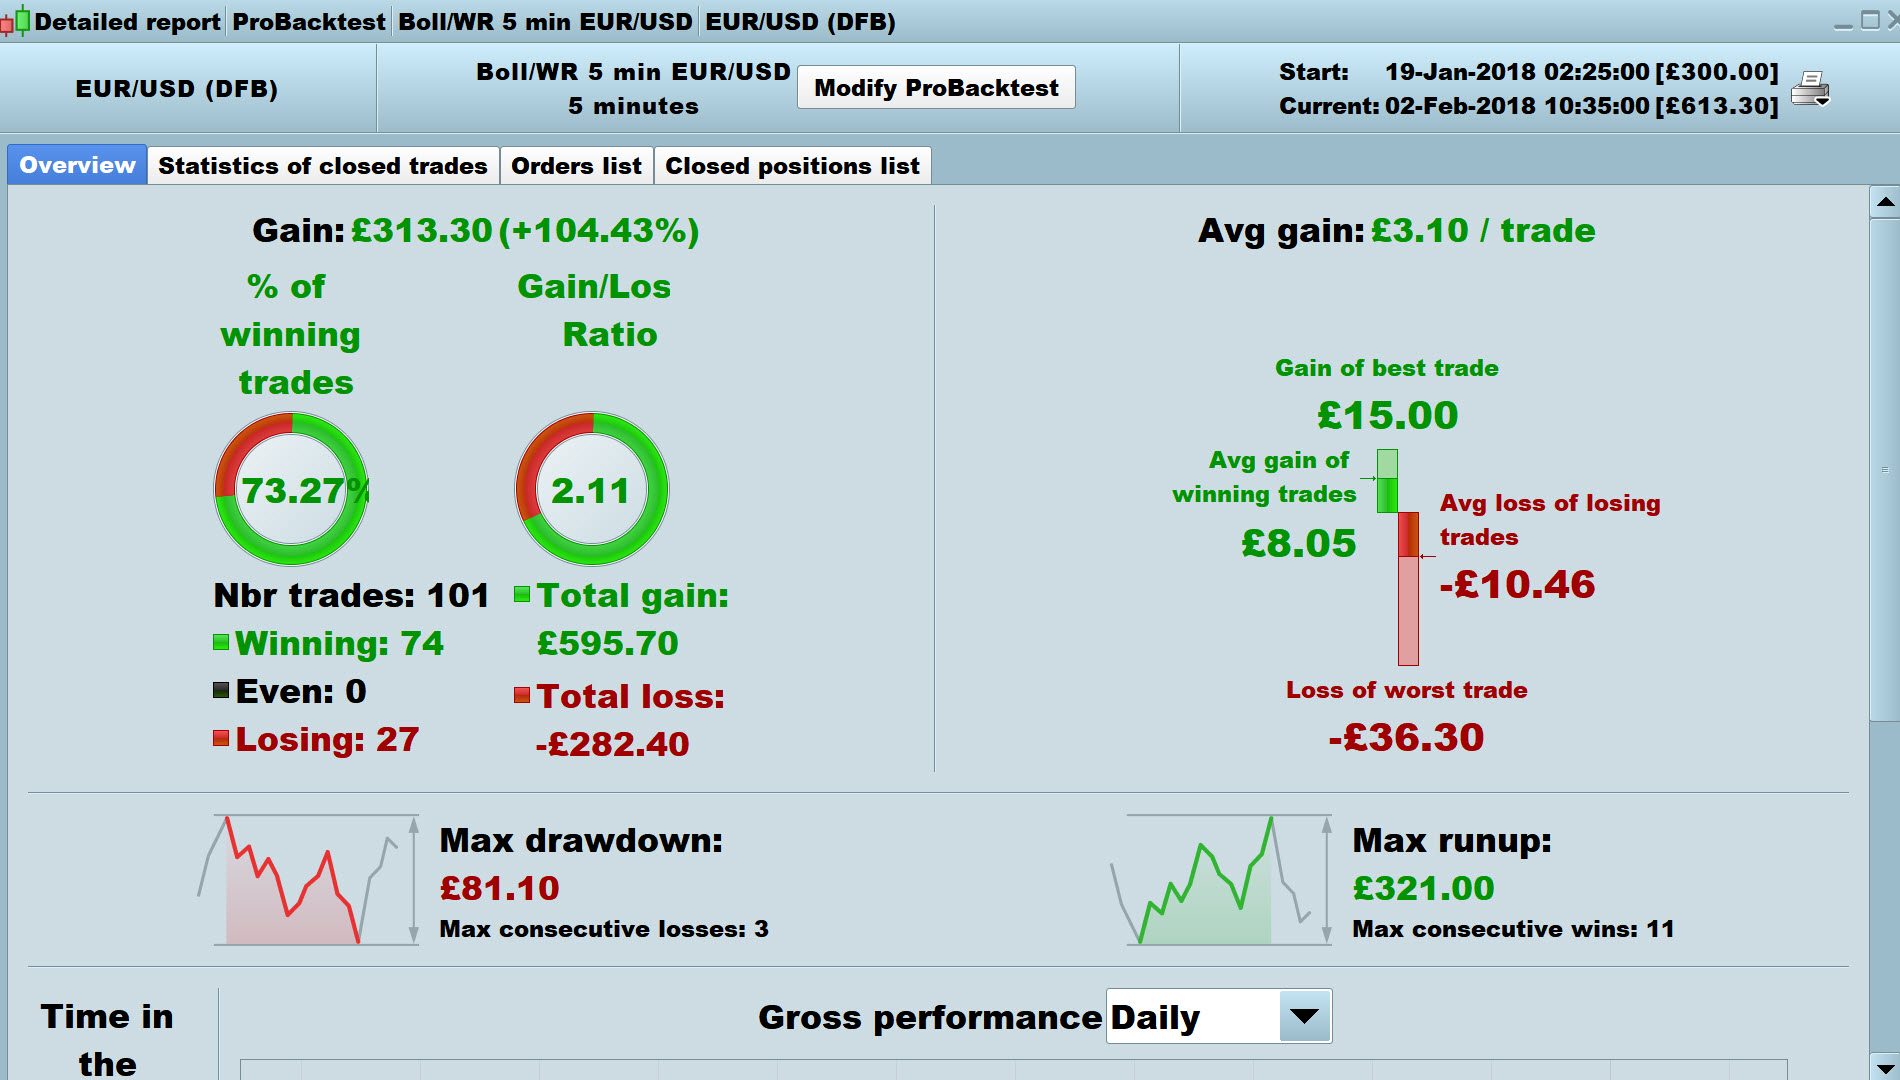
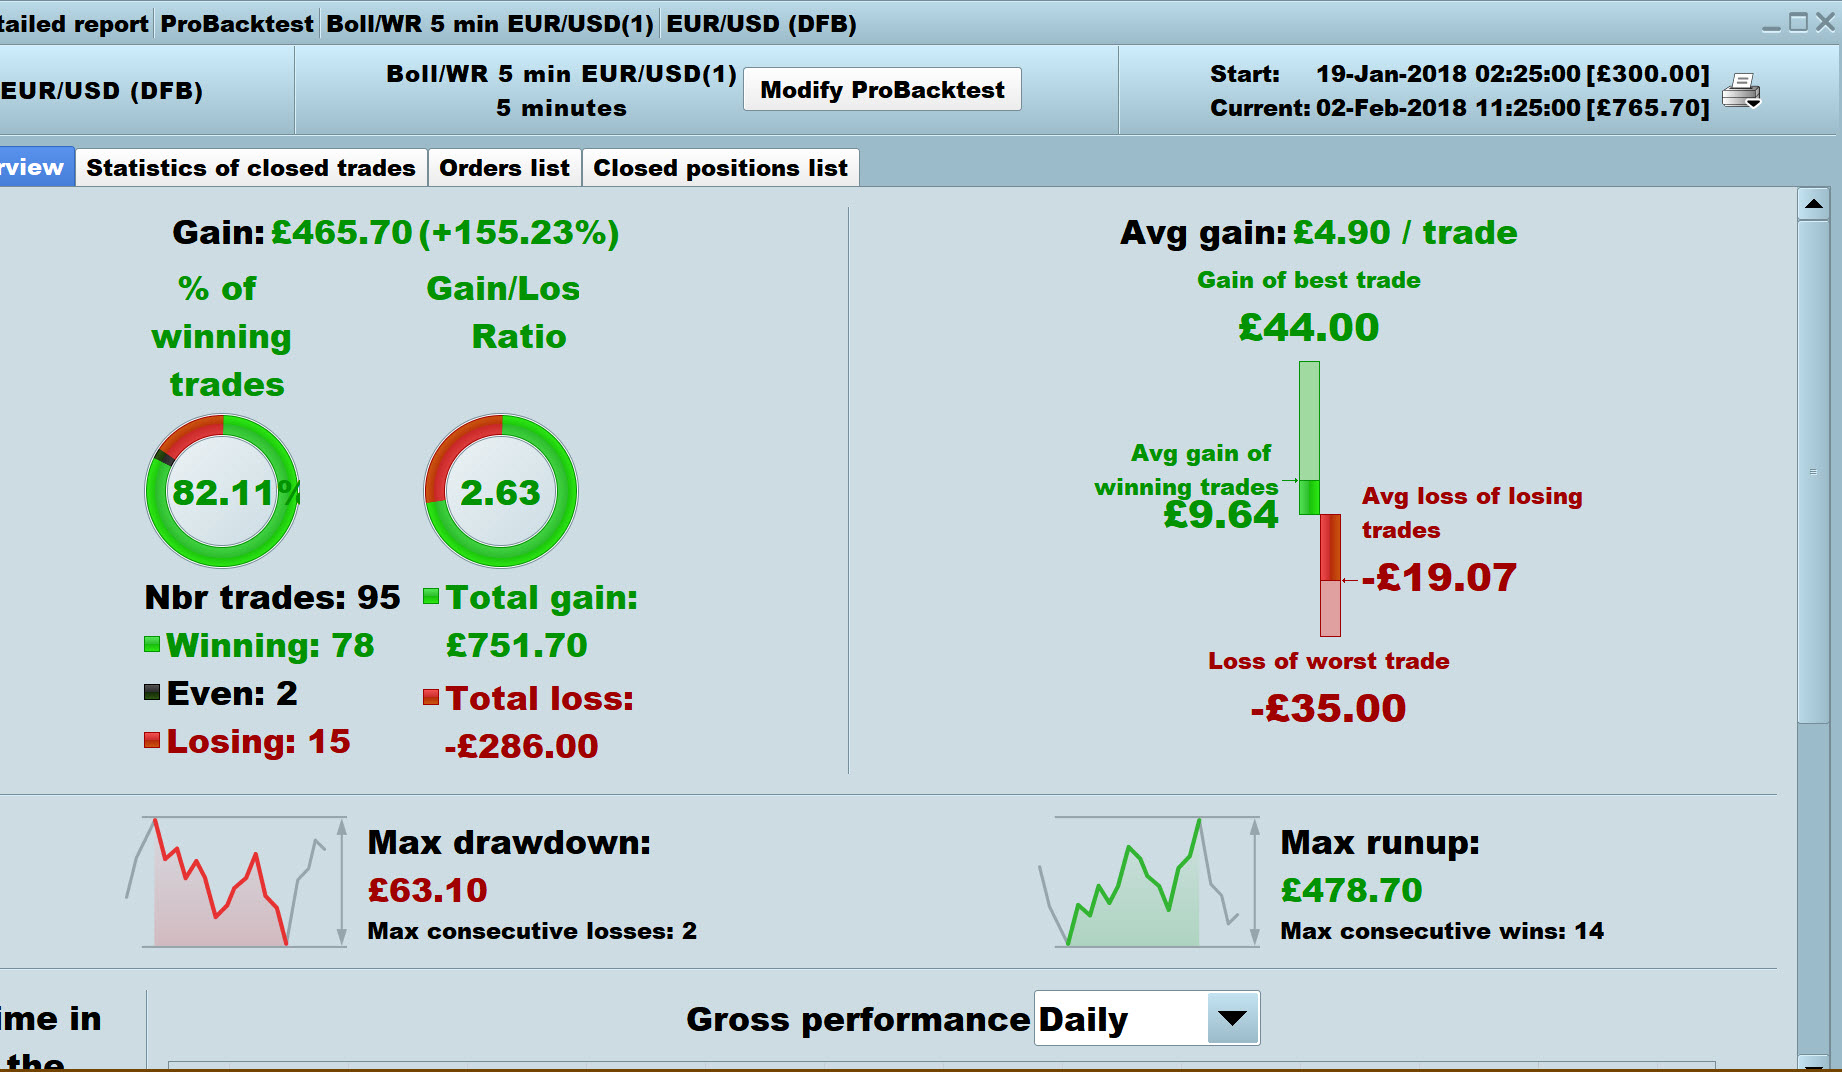
Here’s a better equity curve produced by the changes below different from code in OP.
Even though results are for a general up period, 85% of the Shorts still make profit!
Just shows … sometimes simpler ideas / code can be just as / more effective than hundreds of lines of complex code??
GraHal
// Conditions to exit long positions
indicator3 = Average[90](close)
c3 = (close CROSSES OVER indicator3)

IF c3 THEN
SELL AT MARKET
ENDIF

indicator6 = Average[90](close)
c6 = (close CROSSES UNDER indicator6)

IF c6 THEN
EXITSHORT AT MARKET
ENDIF

// Stops and targets
SET STOP pTRAILING 35
SET TARGET pPROFIT 15
Hello,
Interesting, but you forgot to put the spread.
it seems that with the spread the system is not viable
Best regards
Oya
you should put in NoEntryTimeBefore and NoEntryTimeAfter and set them to 090000 and 220000
then you can enter the spread, let´s say 0.8 – 1.0
after that you will have quite realistic results.
Barichini my results are with spread = 1 (as I stated).
raphaelopilski please post results (and code) you got (with time limitations) then we not all repeating the same exercise etc?
@GraHal
I didn´t program it yet. It was just an idea 😉
Hi All,
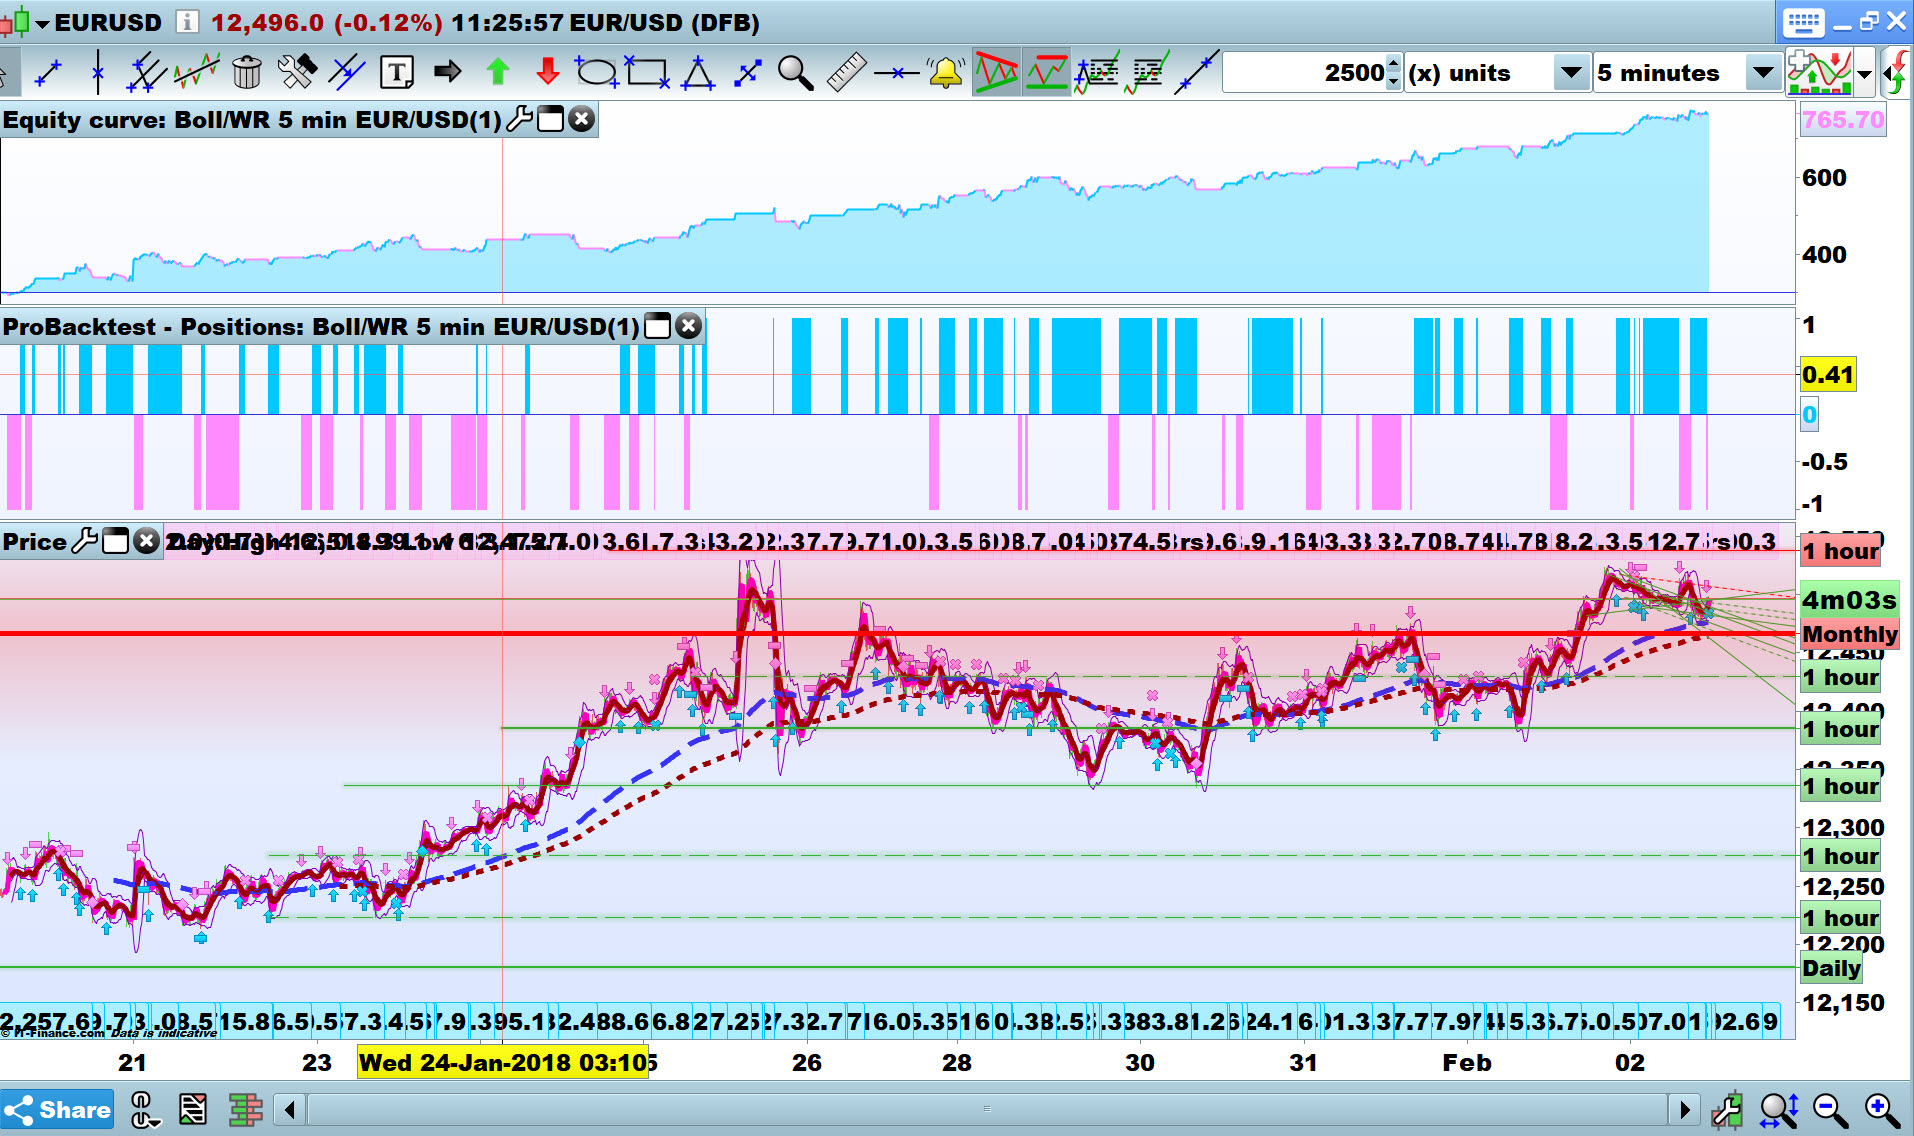
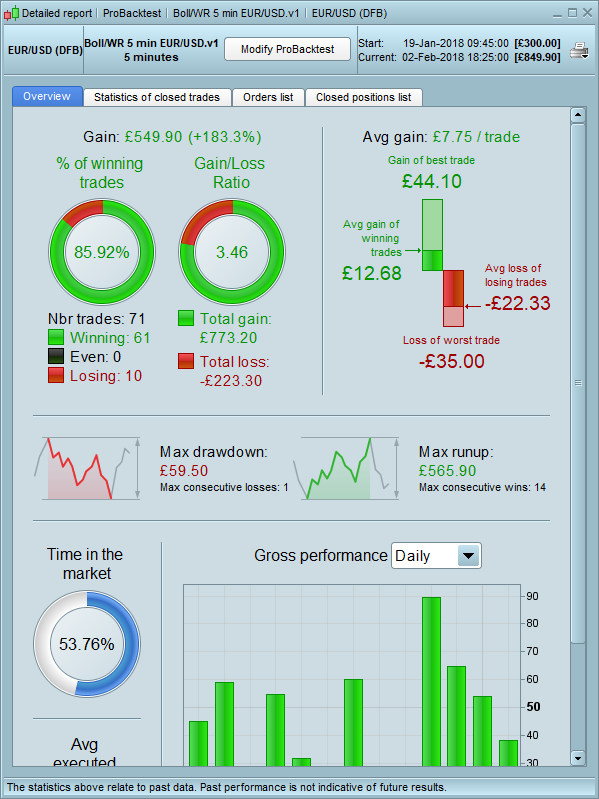
Thanks for your valuable feedback, i have taken all your feed back on board and made a few tweeks myself. results looking impressive.
Hey yeah Jusmih1, looking good!!
Keep doing what you do! 🙂
GraHal
good work! but the backtest is only good for the last days. the idea is good, but i think you still have to work on it….
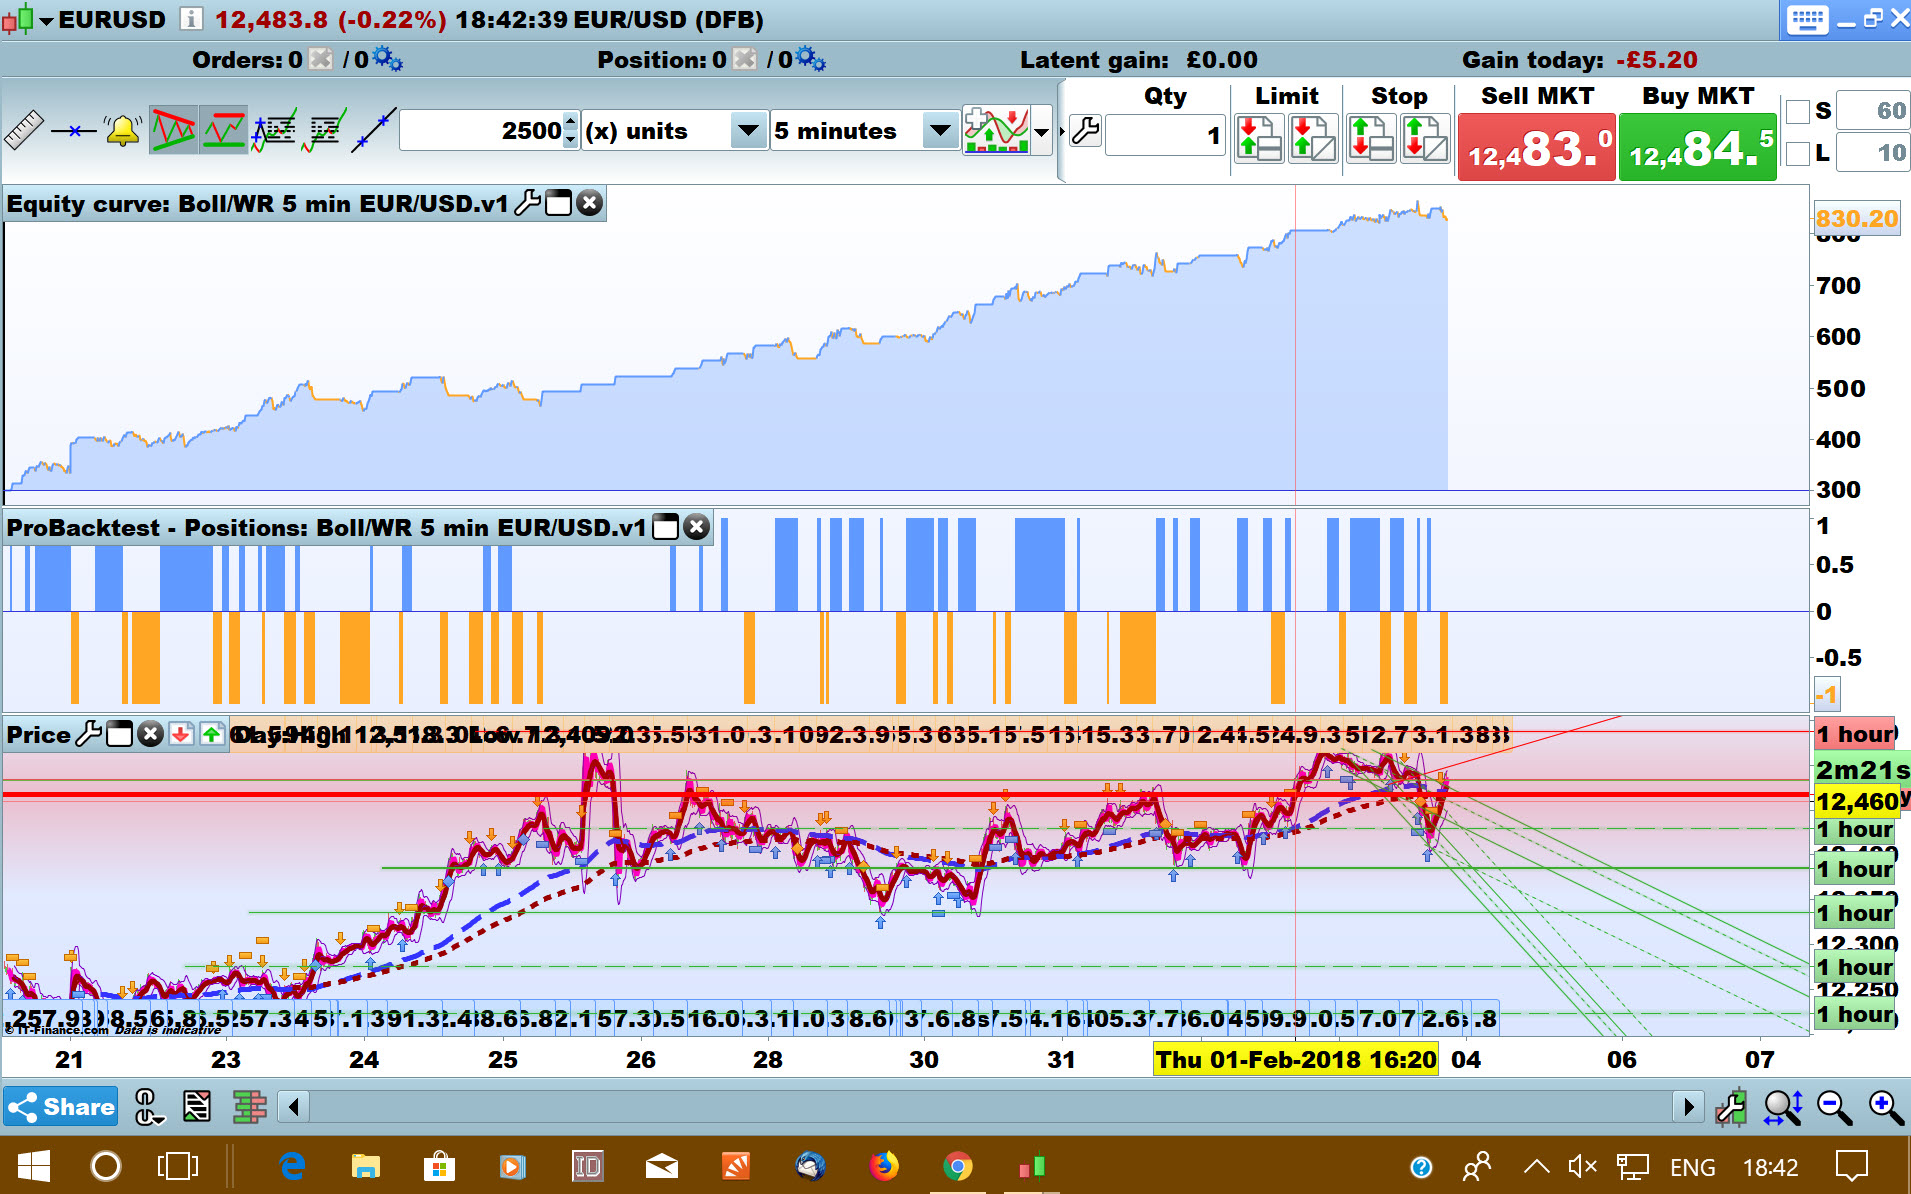
@raphaelopilski PRT will only allow tick by tick for 2500 bars … hence our short period results.
If you are able to backtest for a longer period (in tick by tick mode) then please post results on here?
Thanks
GraHal
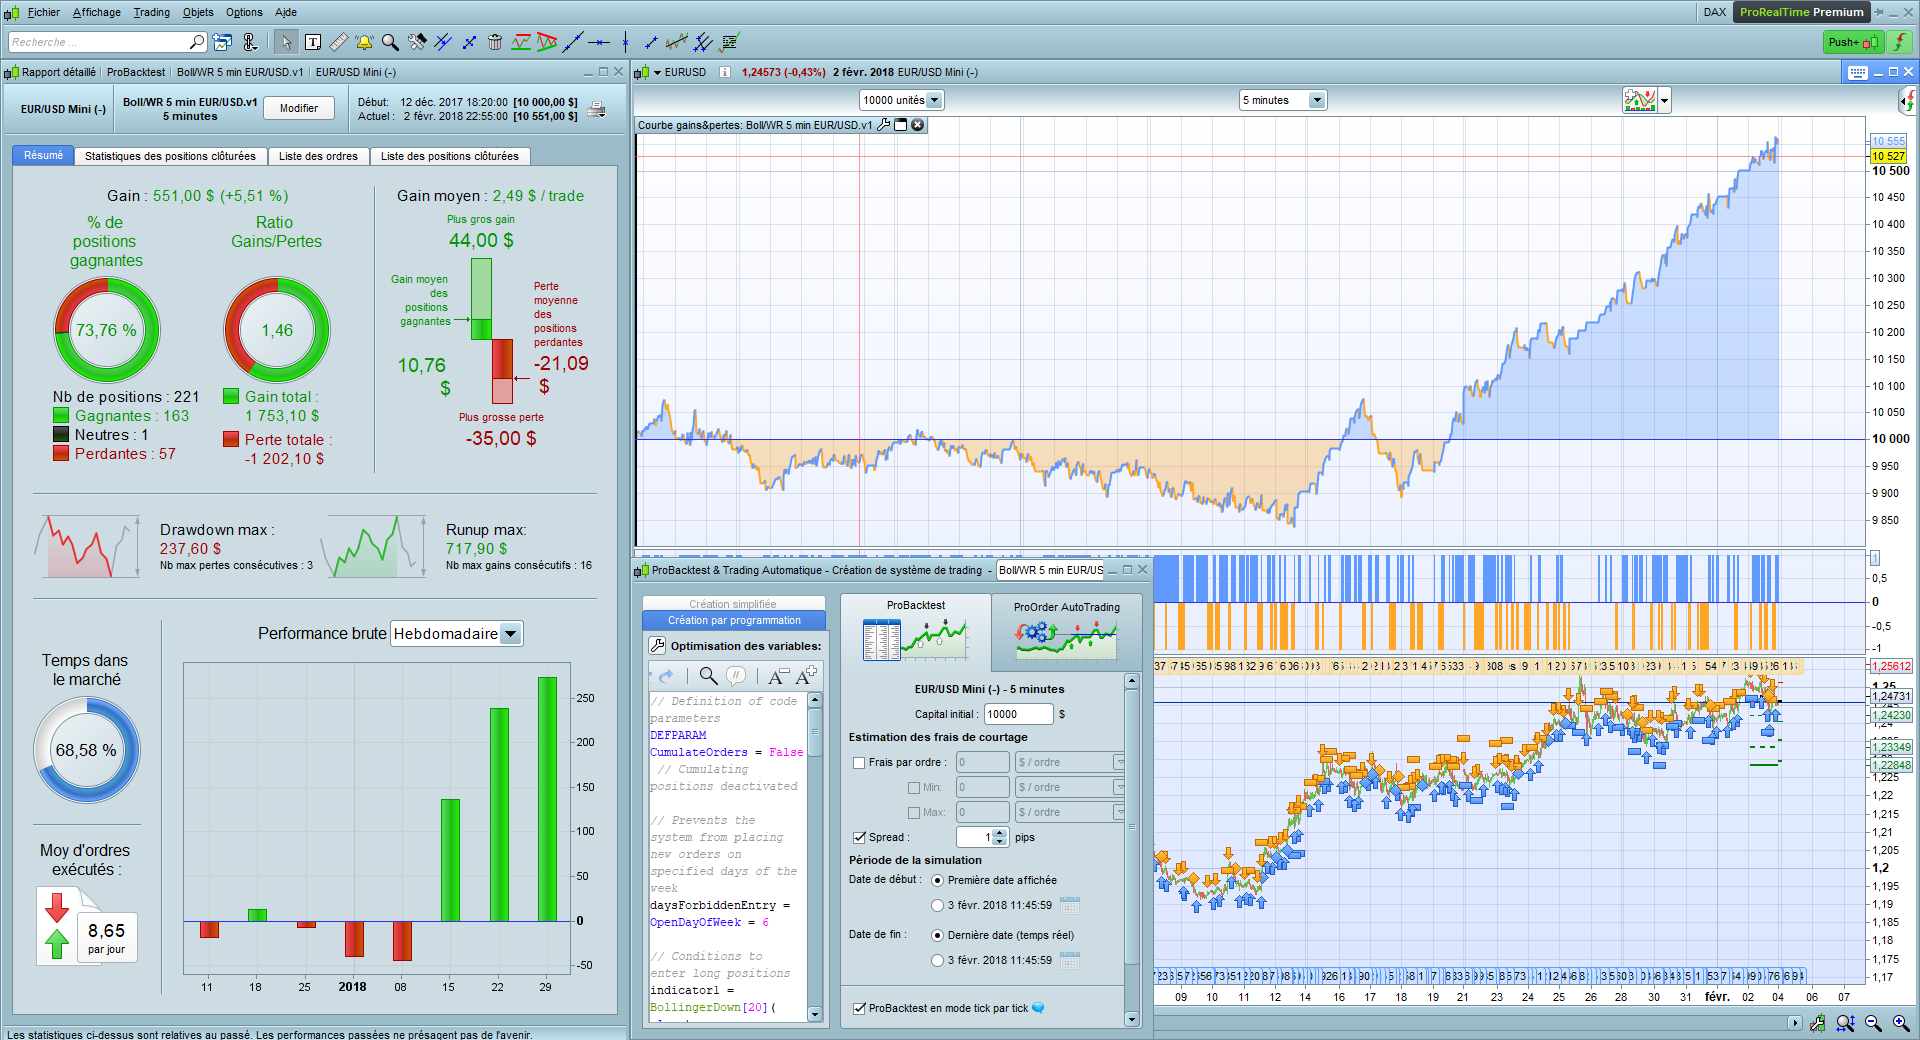
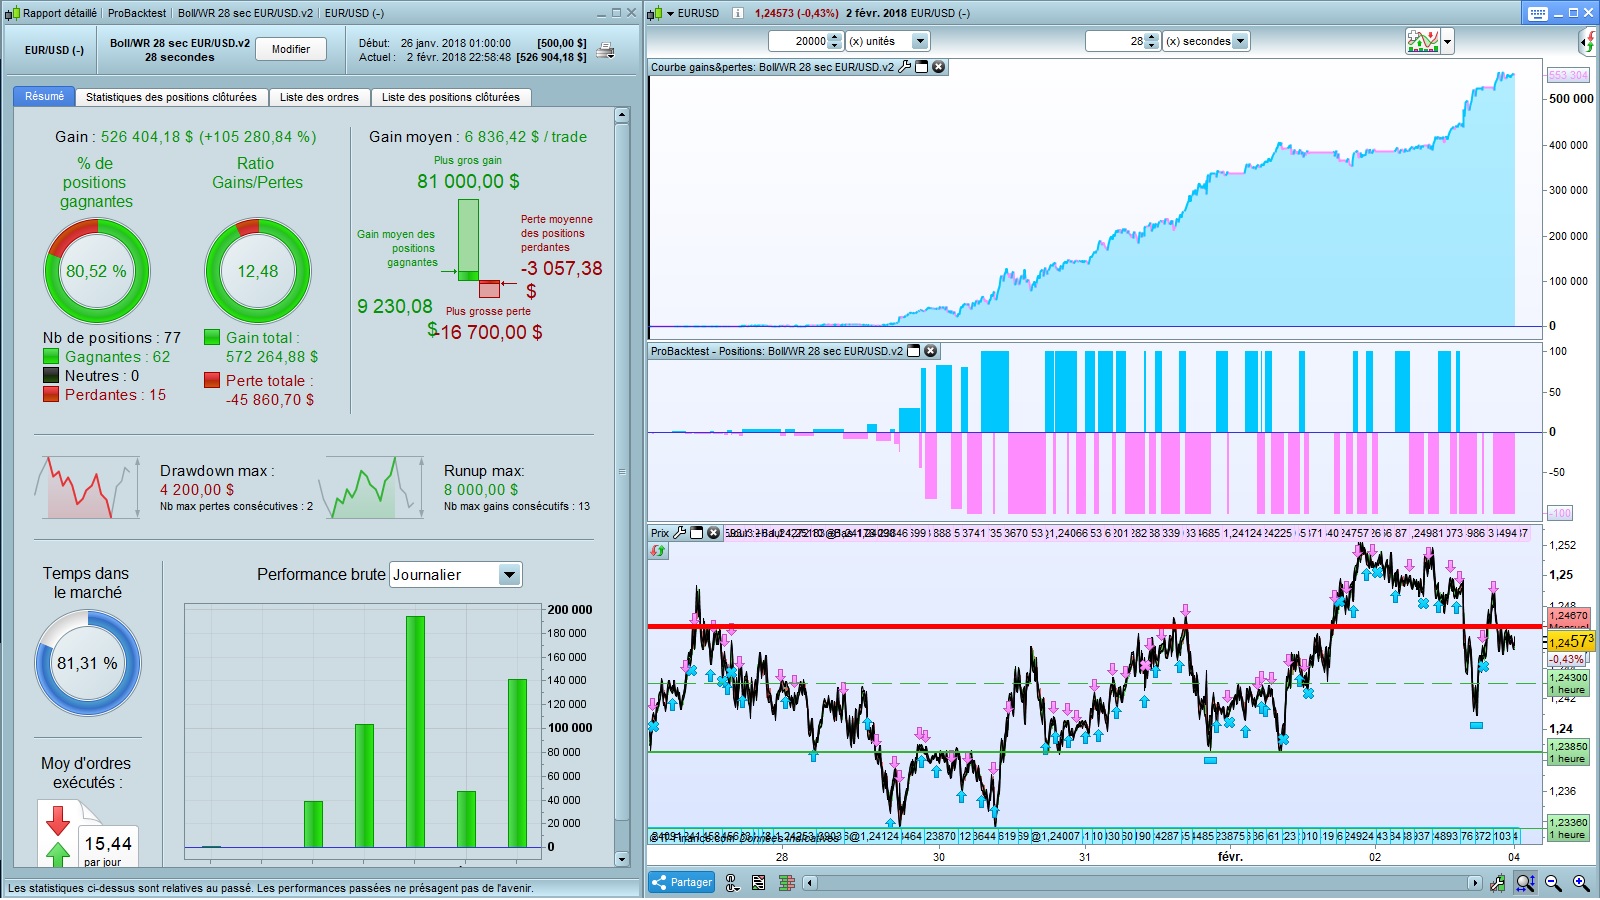
Hi All,
Thanks for your strategy. Below the strategy optimized on TF 28 sec. Stay on your seat !!!
Thank you @Inertia. I guess you have the premium version?
I tried to select 2500 bars but starting on 12 Dec, but I can’t do that either, seems it’s only the most recent 2500 bars I have access to.
So @Jusmih1 you need to comment out the Trailing Stop as below and replace with one of the several ‘Trailing Stop Snippets’ on here. Nicolas has done a a few in his Learning Blogs and there are several ongoing Dynamic Trailing Stop Snippets being discussed in recent threads.
Above will remove the ‘Tick Mode Count’ in backtest results and so will allow a backtest over 10K / 100K bars. Then we can see what your Strat is capable of?
If anybody would like to to help a newbie coder / Jusmih1 and pop a trailing stop snippet in his latest code in #61298 and post results and the code on here then I’m sure he’d appreciate it. I just had a very quick go (short on time today) but results were not good.
GraHal
//SET STOP pTRAILING 35
Hi @Gertrade
Is your wallet really that deep that would do 100 Lots per trade?? 🙂
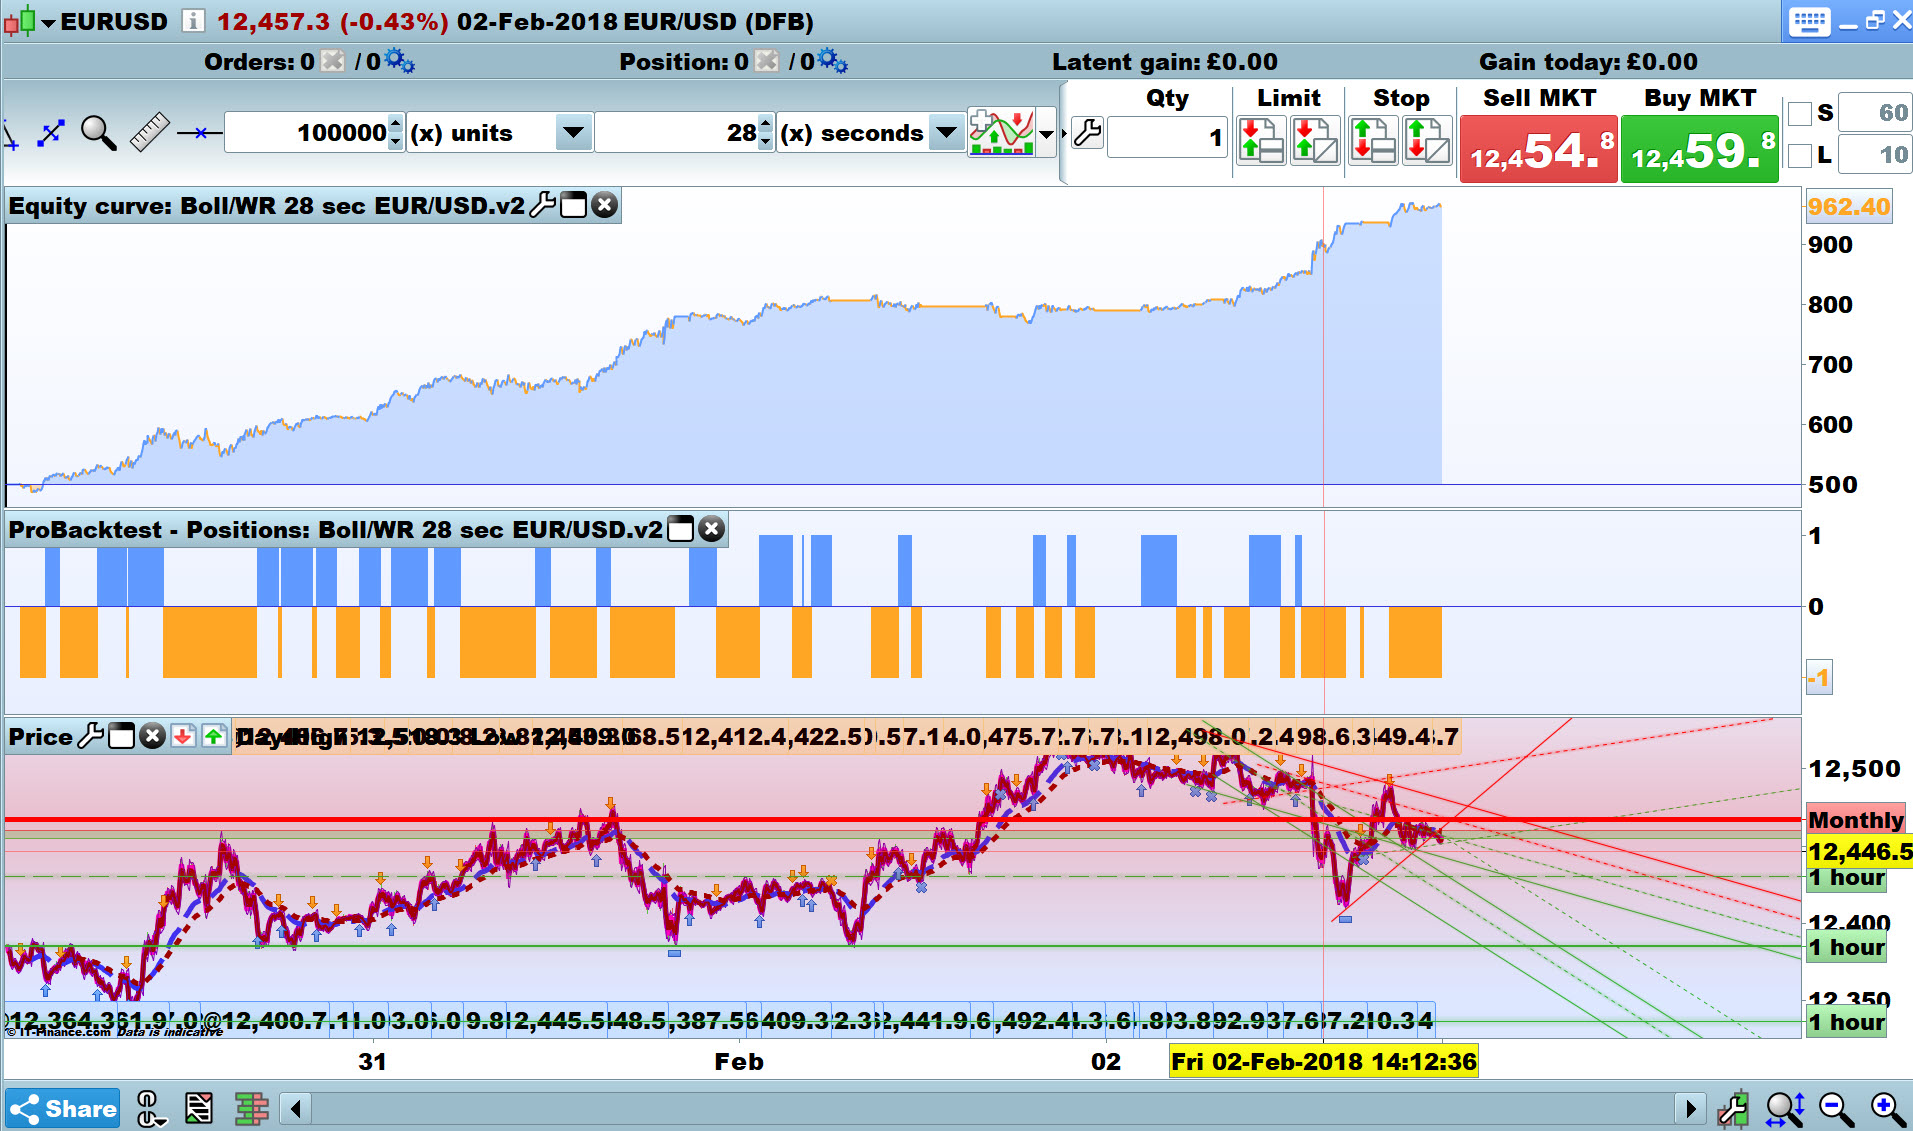
In my opinion, it’s best – for comparison with other Strats – to have a standard 1 Lot size. So below are results for 1 Lot (still good!).
Would a 28 sec TF even run in Live. I thought the TF had to divide into 24 hours exactly?
So below is results for a 30 sec TF … strange they should so different from 28 sec TF? Anybody got any ideas why?? Couldn’t be curve fitting surely with only 2 sec difference??
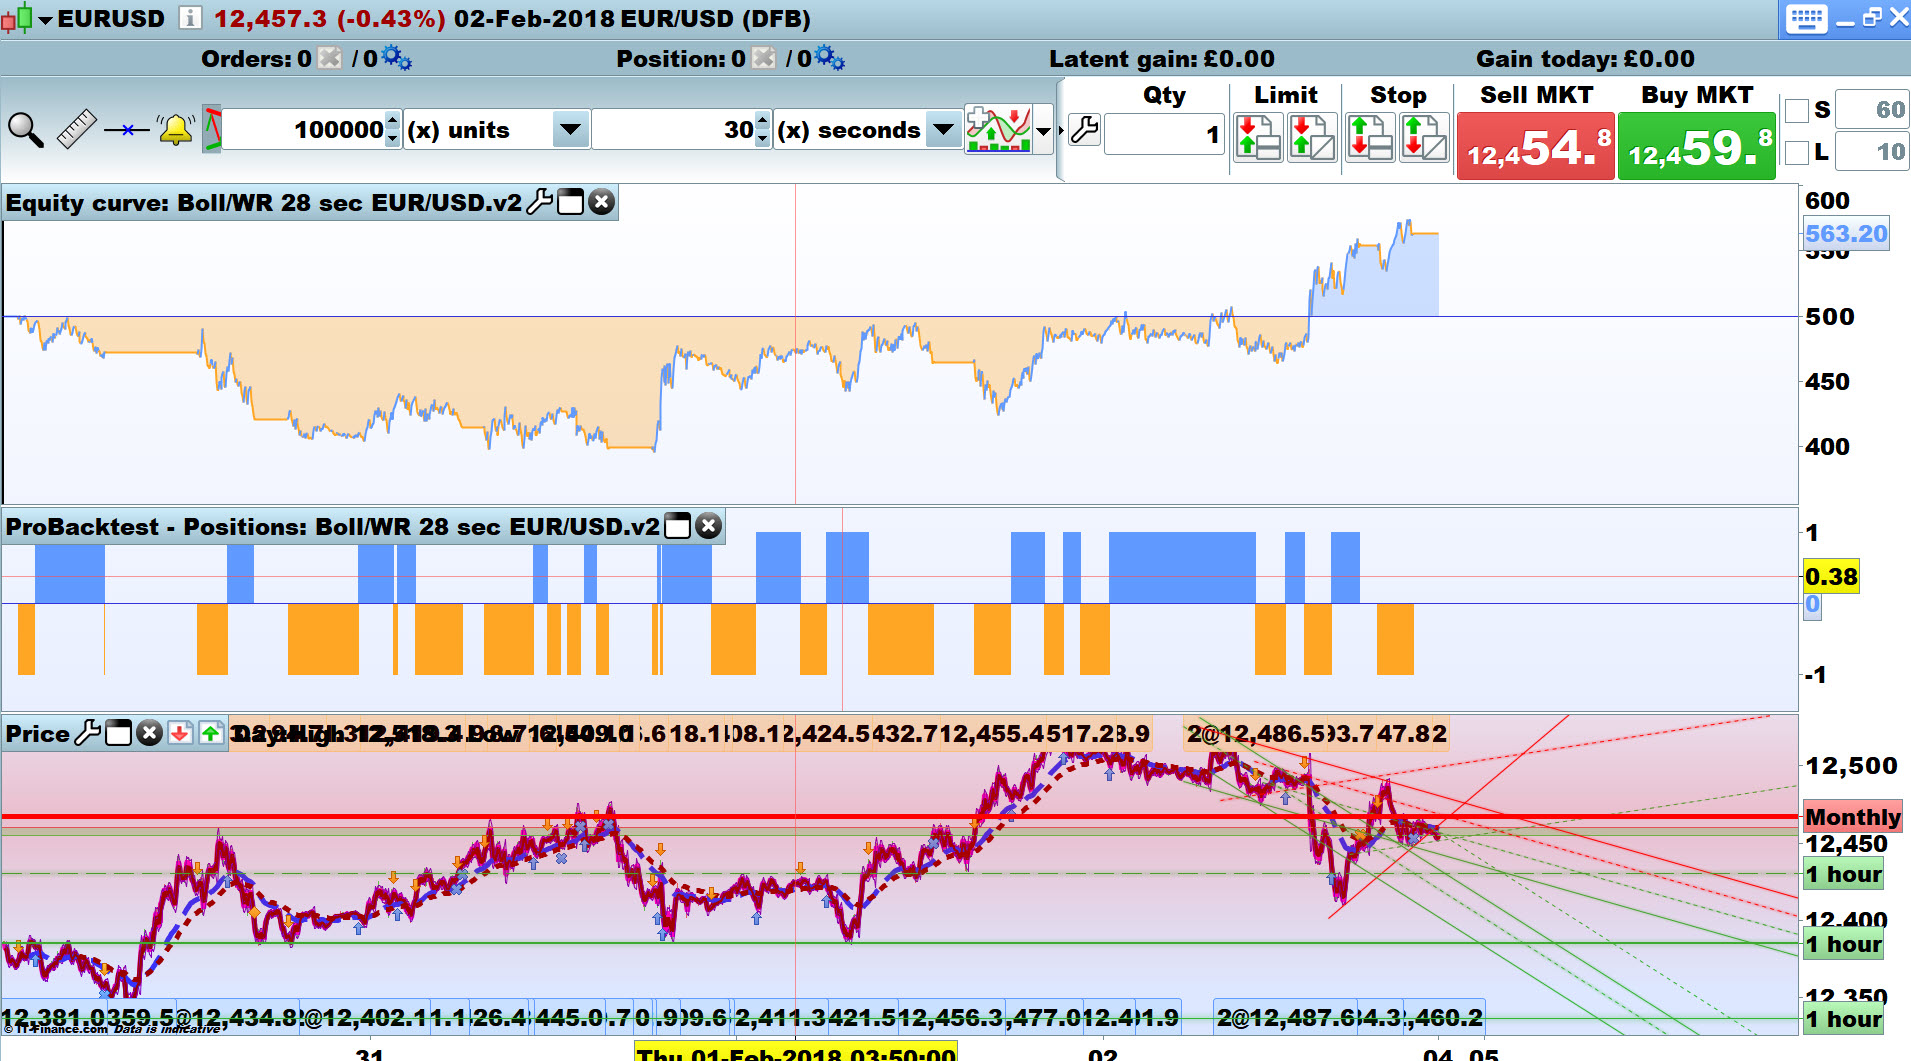
Is it that the trade is already live before the 30 Sec Strats kick in maybe?? To explore that theory, the 3rd image is a 25 sec TF … which does divide into 24 hours exactly at 3456! 🙂
GraHal