S&P 500 mean reverting strategy

S&P 500 mean reverting strategy

Dear all,

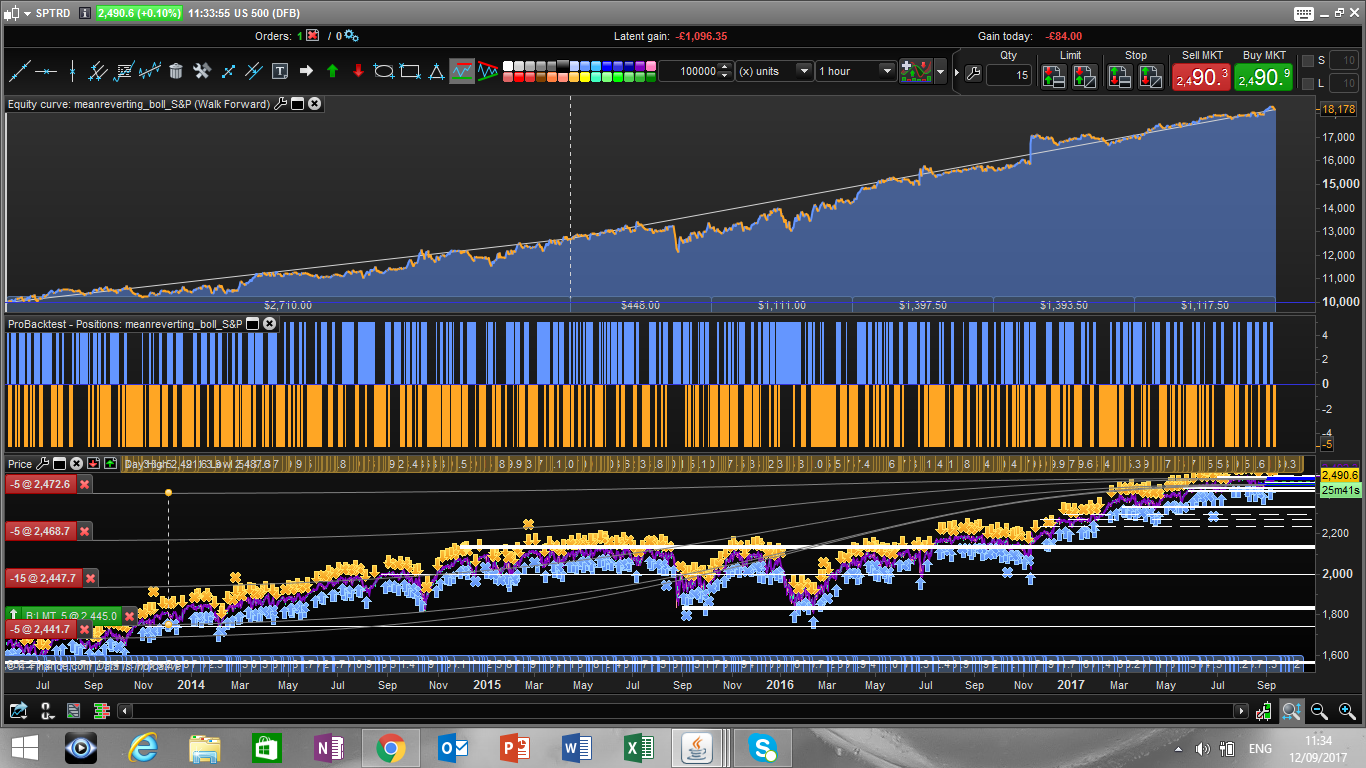
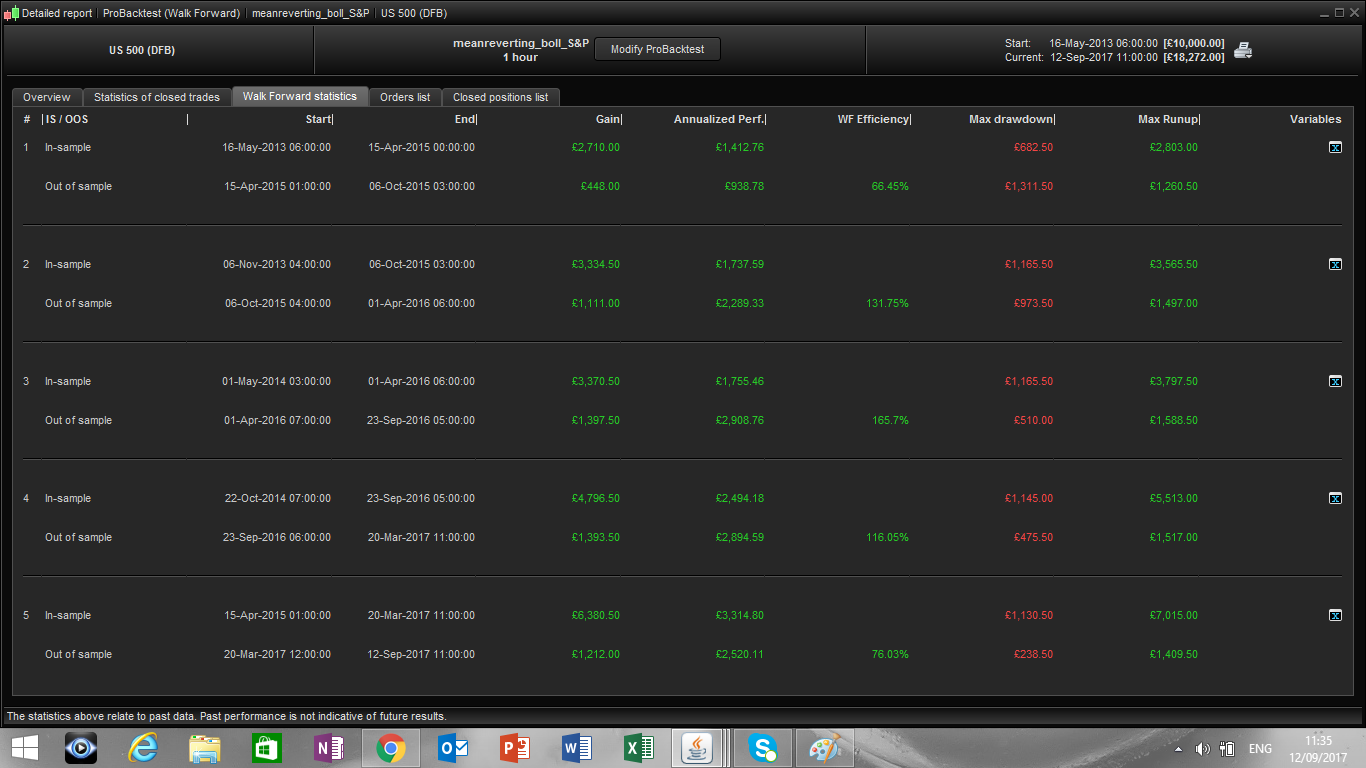
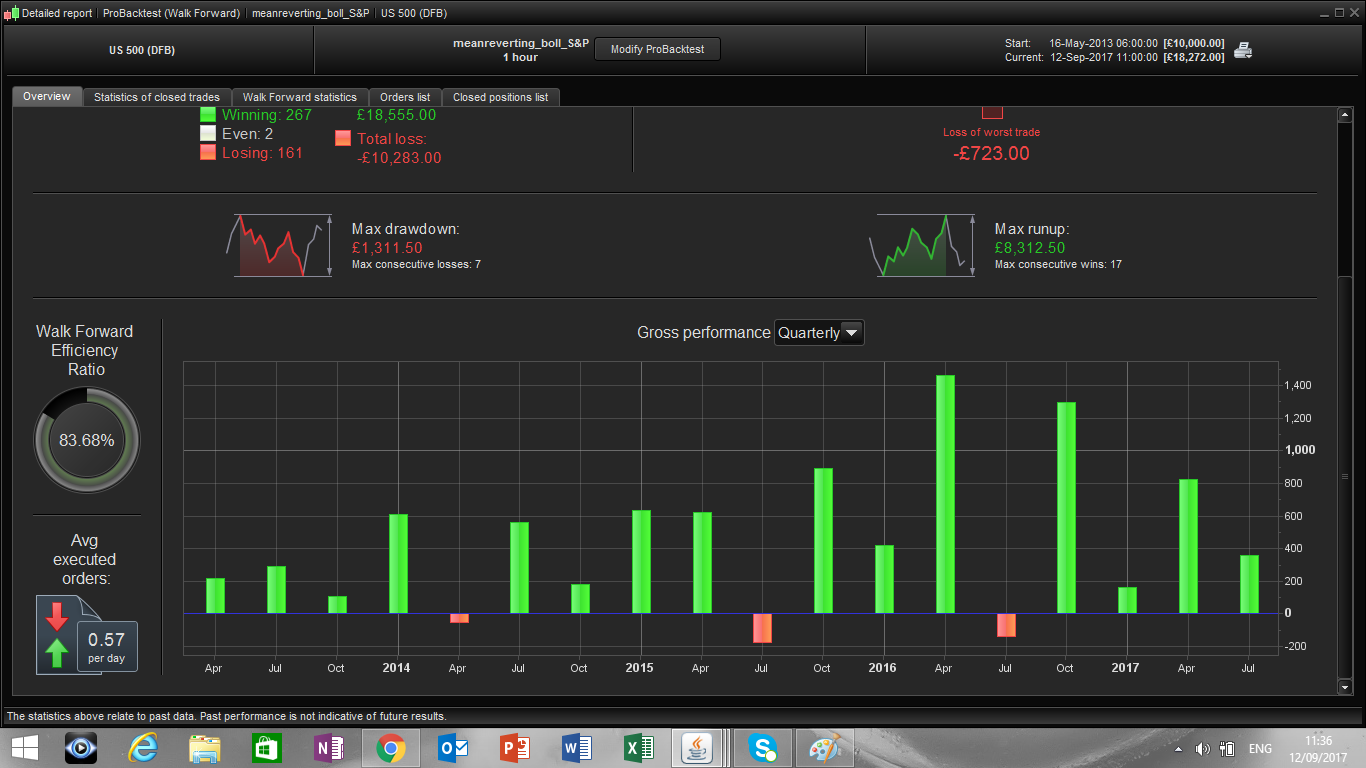
pls enjoy this little code which gives very nice results on S&P 500.

There are only 2 variables optimized (the bollinger bands and the moving average periods) , can work with several underlying.

Best regards

Francesco

Share this

Risk disclosure:

No information on this site is investment advice or a solicitation to buy or sell any financial instrument. Past performance is not indicative of future results. Trading may expose you to risk of loss greater than your deposits and is only suitable for experienced investors who have sufficient financial means to bear such risk.

ProRealTime ITF files and other attachments : How to import ITF files into ProRealTime platform?

PRC is also on YouTube, subscribe to our channel for exclusive content and tutorials

  1. Giorgio Ravagnani • 09/13/2017 #

    Hi Francesco,
    I’m Giorgio nice to meet you, I’ve been following you and your work for some time and i think that are really interesting what you are doing, can you explane me how does it function? I’m little confused about the operation

    Thanks so much

  2. Francesco78 • 09/13/2017 #

    Hi Giorgio! thank you. Relatively to this last strategy, it simpli take long or short position if the candle is fully above or below the bolliger band defined by bperiod and it closes the position when the price touches the average defined by averageperiod. Hope this help

  3. Giorgio Ravagnani • 09/13/2017 #

    Do you test it on a Demo or Real account?

  4. Francesco78 • 09/13/2017 #

    real. I never used a demo account.

  5. Giorgio Ravagnani • 09/13/2017 #

    I prefer test a strategy for a while but i understand your point of you.. When you decide to stop the system? When it exceed the max drawdawn of the backtest?

  6. rejo007 • 09/13/2017 #

    on backtest since 2007, i don’t have very good results.
    (i could’nt attach a file here)
    you have the same?
    thanks

  7. Francesco78 • 09/13/2017 #

    hi Rejo007. I havent tested since 2007 but I am not surpised that this stratrgy doesnt perform well im 2007 2008 and 2009 as they were very trendy. As a general rule I think one should have in the portfolio a combination of strategies, some mean reverting and some breakout

  8. robdav • 09/13/2017 #

    Hi Francesco,

    Just out of interest, do you run this live?

    If so, what period of data do you back test/walk forward it over to optimise the settings?

    How often do you re-tune it?

    Many thanks

    Rob

  9. Francesco78 • 09/13/2017 #

    Hi robdav, yes Im running it live since I posted it. Backtest/WF was for the last 3 years. I havent re tune it, I think I will do so every 6 months

  10. robdav • 09/13/2017 #

    Thanks Francesco, interesting.

  11. stefou102 • 09/13/2017 #

    I came up with a pretty similar strategy, although in my experience the following test works better:

    GoShort= close[1] > BolUp and open > BolUp and close < Bolup
    GoLong=close[1] < BolDown and open Boldown

    Any other ideas of filters to improve this?

  12. Wilko • 09/13/2017 #

    The close at MA condition does’t make much sense as this strategy will stay in market until a position is opened in the opposite direction. Try changing the exit condition to for long positions CLOSE > BOLLup and for short positions CLOSE < BOLLdown. This will give similar results to the original strategy.

    In my opinion this is the typical kind of strategy that has benefitted from the combination of QE and increased algorithmic trading activity in markets. The latter provides added short-term liquidity to market while QE adds long-term liquidity, the combination contributing to a trend towards lower risk premia. I would not want to keep trading this strategy when global QE reverses, or when global economic growth stutters.

    Many thanks for an interesting contribution! It did challenge me to some exploratory work.

    • Aaron Bennett • 09/13/2017 #

      Nice analysis, with the proposed tweak I’m seeing great performance since 2008/QE on the CAC40 Daily; not so good prior to that.

  13. danibo • 09/13/2017 #

    Hi Francesco,
    please may you explain how to reproduce your test?

    I use IG markets. Where your data come from? Also you use US 500 DFB but I can find US 550 CFD standard only. Is you TS expected to behave the same way with that?
    Thank you

    Danibo

    • Francesco78 • 09/13/2017 #

      Hi Danibo, I am not sure I undesrtand your question, you simply need to run a backtest on PRT using US 500 CFD. I am using a uk version of IG but you will find the same index on every platform.

  14. danibo • 09/13/2017 #

    Hi Francesco, thank you for replying.

    I try to be crearer. My question is:
    – what is the spread you use in backtest?
    – why can you use US 500 DFB while I can see just US 500 CFD?

    Thank you

  15. JanWd • 09/13/2017 #

    Hi Francesco, nice algorithme, works with me on other markets as well !

  16. Francesco78 • 09/13/2017 #

    thank you Janwd. Do you mind sharing where it works? happy new year!

avatar
Register or

Likes

avatar avatar avatar avatar avatar avatar avatar avatar avatar avatar avatar avatar avatar avatar avatar avatar

+11 more likes

Related users ' posts
phoentzs
5 months ago
Gio56 Bonjour, merci pour ce code. j'ai juste un problème sur le code, j'ai un message “L’instru...
Nicolas Il faut supprimer cette ligne qui est utile uniquement pour visualiser des valeurs durant le...
Gio56 Super merci Nicolas cela fonctionne. Top
Fgats
6 months ago
bousalahane hello, thank you for sharing, I’m not top strong in the programation part, there is a way to...
Fgats Hi, With this indicator I just wanted to show the interest that can exist to synthesize th...
davidguerreir how to adapt nbStdSig values ?
FXtonio @RICOU en 1 minutes avec un filtre de tendance ZLSMA 200 et eventuellement un rsi 7 , 69% de...
JC_Bywan For people interested in the screener: https://www.prorealcode.com/topic/screener-buy-sell-m...
octum Gracias NJicolas. Las lineas 35 y 36 dan fallo. (¿Es adrede para iniciados?) Puedes co...
geroniman bonjour si je comprends bien, qaund els points sont verts on regarde pour un long, le blanc ...
Alfy No, the dots only show the compression of the volatility. There are 3 levels of "squeeze" wh...
ted.hulsman Hi Alfy, I'm trying to understand your indicator, so I made the Bollinger Bands and the Kelt...
bab el franco hello once installed I have no results despite different options of markets or temporality
Nicolas Sorry there was a small issue in the code, i have changed the attached itf file and updated ...
Mitchy14 Hi Nicholas, apologies, I am usually fairly good at implementing your creations (for which I...
Nicolas Are you using PRT version pre-v11? TIMEFRAME for indicators is possible since months for pro...
Nicolas Merci d'ouvrir un sujet dans le forum des screeners en respectant les règles de publication ...
Pensera Bravo Nicolas ! Tu es en quelque sorte l’inventeur de Metascore…(oups je viens de lire jusqu...
Nicolas Dans un but d'investissement pure, et non spéculatif.
Fabian Hi Thomas, thanks for your explanations. Which indicator do you use in the screenshot ...
Thomas Thats On Balance Volume and Bollinger or SMA or what you want. It shows me the volume flow. ...
bertrandpinoy @MAKSIDE I would be grateful if you send me your version. have a nice day
oraclus Bonjour indicateur très intéressant existe t il un screener qui détecte les actions qui donn...
IV Mcm Ce n'est pas le but de cet indicateur, mais avec un peu d'entraînement vous pourriez le code...
Yantra Thank you for sharing your good work!
imonix Have been trying this on demo since Monday before deciding whether to go live with it. Using...
Roberto Blázquez I'm sorry, I've tried it since November 2012 and it's bad results.
Dunstan I would like to get guidance_ How do I access and attach this indicator to my MT5 platform...
Nicolas You can't, use prorealtime, it's way better
jc84 Thank you very much for this indicator , not provided by PRT I was actually working at thi...
Pierreco1991 Hello Can you confirm this configuration for FRANCE ? //Time in UTC+8 Rest0Minutes =...
Nicolas Ask on an Excel website?!
JJMR HOLA NICOLAS, TENGO LA ULTIMA VERSION ACTUALIZADA DEL INDICADOR TTM SQUEEZE PRO EN LA VERSIO...
imokdesign @nicolas ,if in want to "call" this indicator, which values i have to write down?
supertiti Bonjour Nicolas, Je ne comprend pas bien , le trend change de couleur quand les prix sont a...
Nicolas Oui ce serait possible, cependant l'indicateur est bien prévu pour conserver la couleur de l...
supertiti Quand tu pourras si tu peux nous coder la troisième couleur cela améliorerait les trades cou...
Vinks_o_7 Thanks Doc !
Maxime Baudin Intresting, thank you!
Zigo Normaly it do work in version 11.
bertrandpinoy Hello to all, please does a coder can bring the indication of the price level on the chart o...
Zigo @bertrandpinoy add between line 50 and 51 : drawtext("#dnh#",barindex,low-2.618*AverageTrue...
supertiti Hello Jan You must use this code in correspondence with other indicators, a code alone do...
Franro Hi, this looks very good is this something you worked towards a strategy?
hua hin Bonjour comment mettre ce programme sur un graphique le lien est en JPG et sur crewation i...
Bard I've also just noticed that changing the "Bands Deviation" setting from 1.25 to eg 3 doesn't...
bartekz Hi @Nicolas, Really impressed by your work. I am trying to replicate the Wave-PM indicator t...
Nicolas You don't have to replicate it, download the file and import it into your platform.

Top